
Why Volatility Is Not the Same as Risk — and Why the Distinction Matters
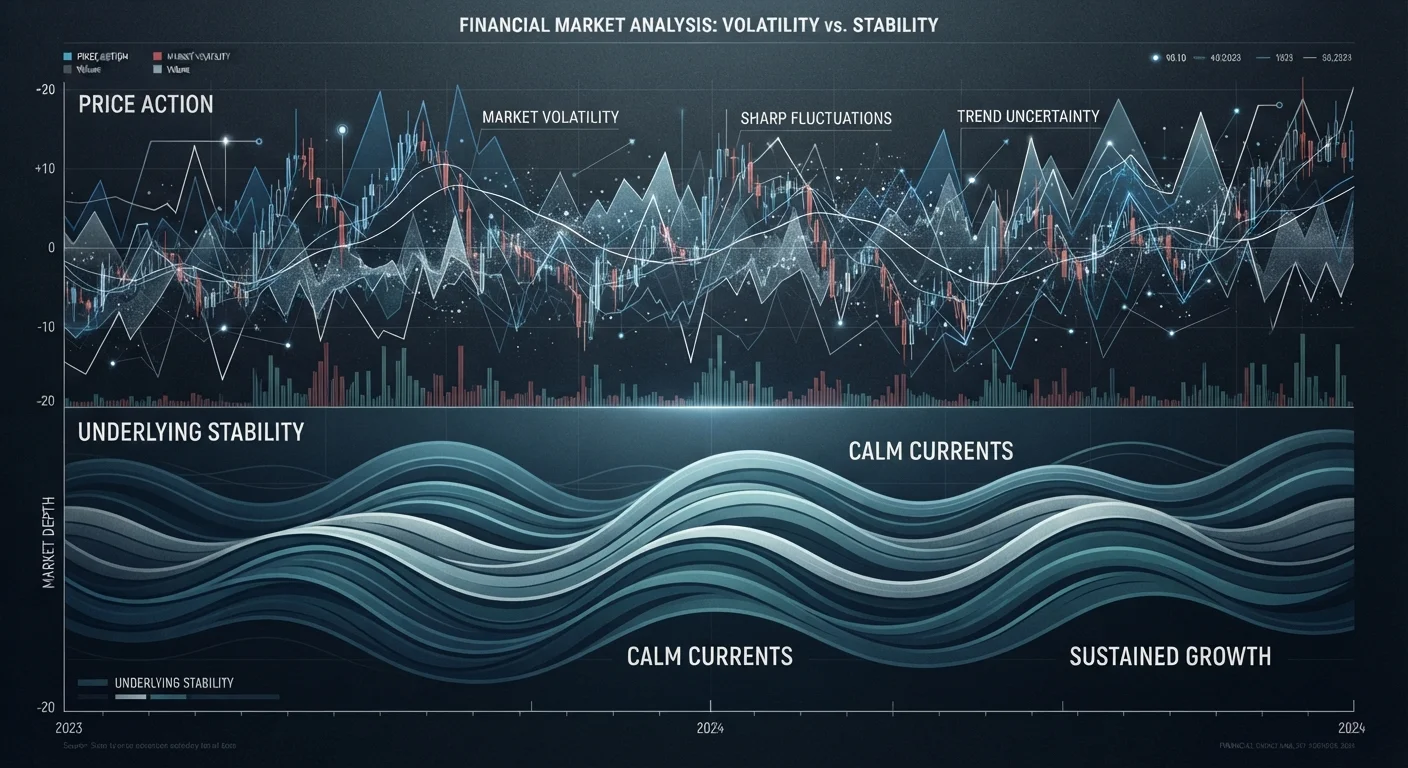
Photo credit: NewBizBuzz.net | Financial Insights For All
In this article
Volatility and risk are often used interchangeably, but they describe different things. Understanding the difference shapes how you read market swings.
Key Takeaways
- Volatility measures how much a price fluctuates; risk measures the probability of a permanent or meaningful loss.
- A volatile asset is not automatically a dangerous one — context, time horizon, and fundamentals all matter.
- Equating the two can cause investors to sell quality holdings during temporary downturns at a real cost.
- Standard deviation, beta, and similar metrics quantify volatility but do not fully capture investment risk.
- Understanding the distinction helps investors make more disciplined, goal-aligned portfolio decisions.
Two Words, Two Different Concepts
In financial commentary, volatility and risk are frequently used as synonyms. That habit is understandable — both words evoke discomfort, and price swings do feel threatening in real time. But treating them interchangeably leads to analytical errors that can meaningfully undermine long-term investment outcomes.
Volatility is a statistical property. It describes the degree to which an asset's price moves up or down over a given period, typically measured using standard deviation or metrics like beta. A stock that gains 4% one week and loses 3% the next is volatile. That movement is observable, quantifiable, and — crucially — not inherently bad.
Risk, by contrast, is about outcomes that matter: the probability of losing capital in a way that is permanent, or failing to meet a financial objective. A bond that returns slightly less than inflation every year for a decade may carry very low volatility while still posing meaningful risk to a retiree who needed real growth. The Risk & Return hub explores this relationship in more depth across multiple asset types.
Conflating the two isn't just a semantic issue — it shapes which assets investors buy, when they sell, and how they interpret normal market behavior.
Common Myths — Corrected
The confusion between volatility and risk shows up in several recurring misconceptions. Each of the following myths reflects a genuine belief held by many investors, and each carries practical consequences when acted upon.
Myth
A highly volatile stock is always a high-risk investment.
Fact
Volatility describes price behavior, not the likelihood of permanent loss. A fundamentally strong company may see wide short-term price swings while carrying modest long-term capital risk.
Standard deviation and beta measure how much a price deviates from its average or from a benchmark — they say nothing directly about whether an investor will lose money over their intended holding period. A company with strong earnings, manageable debt, and durable competitive advantages may trade with high short-term volatility simply because of broader market sentiment or sector rotation, rather than any deterioration in its underlying business. Over a sufficiently long horizon, that volatility often resolves without producing a real loss.
Myth
Low-volatility assets are safe assets.
Fact
Low price fluctuation does not eliminate exposure to inflation risk, credit risk, liquidity risk, or the risk of failing to meet a financial goal.
Cash and short-term government securities may show near-zero price volatility while still exposing investors to purchasing-power erosion over time. A bond that matures at face value but yields less than inflation has effectively lost real value — quietly, without a single dramatic price move. For investors who need their portfolio to grow, a smooth but insufficient return curve can represent a meaningful risk that volatility metrics will never flag. The differences between low and high-risk investments go beyond expected returns.
Myth
Seeing large price swings should trigger a reassessment of whether to stay invested.
Fact
Price swings warrant analysis of fundamentals, not reflexive selling. Volatility without a change in underlying value is market noise, not a signal to exit.
Behavioral finance research consistently finds that investors who react to short-term price movements by selling underperform those who hold through volatility, provided the underlying investment thesis remains intact. The right question during a drawdown is not "how much has the price moved?" but "has anything changed about the business, the asset's fundamentals, or my investment horizon?" If the answer is no, the price decline may represent a temporary dislocation rather than a genuine risk event. Emotional reactions to volatility, treated as risk, are one of the most reliably documented sources of self-inflicted return drag.
Myth
Volatility metrics like standard deviation give a complete picture of an investment's risk.
Fact
Quantitative volatility measures capture one dimension of price behavior but omit credit risk, liquidity risk, concentration risk, and tail-risk events that fall outside normal distributions.
Models based on standard deviation assume returns follow a roughly normal distribution. In practice, financial markets exhibit fat tails — meaning extreme events occur more frequently than a normal curve predicts. The 2008 financial crisis and the March 2020 COVID-19 shock both fell far outside what historical volatility alone would have suggested as plausible outcomes. Crypto markets illustrate this vividly: as described in why crypto prices move so dramatically, structural and liquidity factors can produce dislocations that no standard volatility measure anticipates. Relying solely on volatility metrics to assess risk leaves investors blind to these dimensions.
The Practical Stakes of Getting This Right
When investors treat volatility as the primary signal of risk, they tend to overweight recent price movements and underweight fundamental analysis. The result is often selling during drawdowns — converting a temporary paper loss into a realized one — and avoiding entire asset categories that carry price swings but have strong long-term records.
~30%
Typical peak-to-trough S&P 500 drawdown in major corrections
Historically, the S&P 500 has experienced multiple corrections exceeding 20–30%, yet long-term annualized returns have remained positive across most multi-decade holding periods.
~2x
Return gap: disciplined holders vs. reactive traders
Research from institutions including DALBAR has repeatedly found that average equity investor returns trail index returns, largely due to poorly timed exits driven by volatility reactions.
This matters especially across asset classes. As explored in how stocks, bonds, and real estate risk profiles actually differ, volatility, liquidity, and loss potential vary substantially — and a low-volatility asset is not the same as a low-risk one.
Time horizon is a critical moderating factor. An asset that is volatile over a one-year window may carry substantially lower risk of loss over a ten-year window, particularly if its underlying fundamentals are sound. Separating the signal from the noise requires anchoring analysis to your actual investment objectives rather than to short-term price behavior.
For a related framing, see risk tolerance vs. risk capacity — another pairing that investors routinely conflate with similarly costly results. And for a direct exploration of the cost of mixing these two up, volatility is not risk and mixing them up is costly provides additional context.
This article is for general informational and educational purposes only. It does not constitute personalized financial, investment, tax, or legal advice. Past performance does not guarantee future results. Consult a qualified financial adviser before making decisions based on your individual circumstances.

Author
Stocks & Markets Editorial Team
Stocks & Markets Editorial Team is the collective byline for our editorial team and contributor network. Articles published under this byline or an editorial pen name are researched, written, and reviewed according to our editorial standards for clarity, consistency, and independence before publication.
View all articles →