
Volatility Is Not the Same as Risk — and Mixing Them Up Is Costly
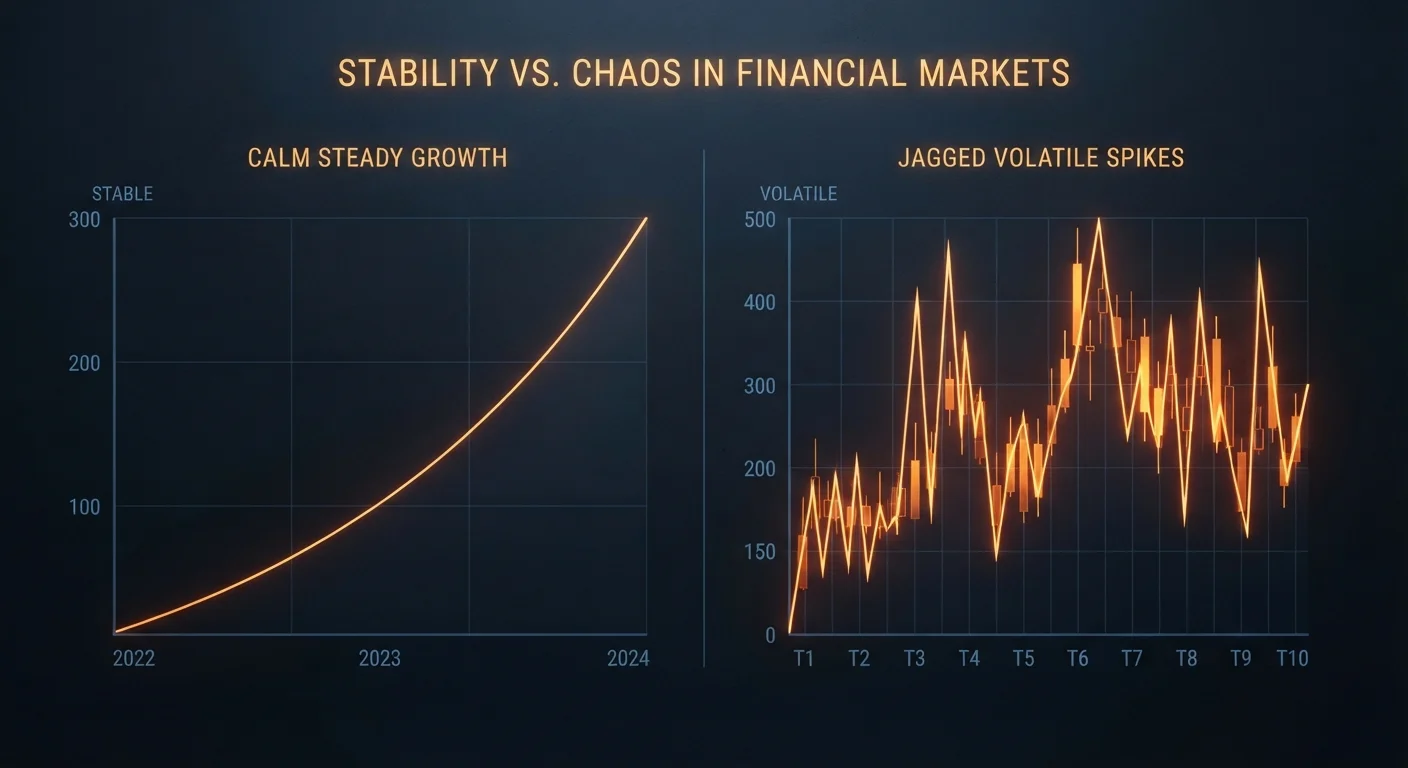
Photo credit: NewBizBuzz.net | Financial Insights For All
In this article
Price swings and true investment risk are related but distinct. Conflating them leads to decisions that can undermine long-term goals.
Key Takeaways
- Volatility measures price fluctuation; risk measures the probability and magnitude of permanent capital loss.
- A volatile asset held long enough may pose less real risk than a stable one held incorrectly.
- Conflating the two causes investors to sell at the wrong time or avoid growth-oriented assets unnecessarily.
- Time horizon is the critical variable that separates short-term volatility from long-term investment risk.
- Smarter risk assessment requires evaluating multiple dimensions, not just price movement.
Why the Confusion Exists — and Why It's Expensive
In everyday financial conversation, "volatile" and "risky" are used almost interchangeably. That shorthand is understandable — when a stock drops 15% in a week, it feels dangerous. But precision matters here. The conceptual gap between volatility and risk isn't semantic; it's the difference between a well-constructed portfolio and one that systematically underperforms because its owner keeps fleeing the wrong signals.
Volatility, technically defined, refers to the statistical dispersion of returns around a mean — most often captured by standard deviation. It describes how much a price moves, not whether that movement leads to a permanent loss. Risk, as most financial economists define it, concerns the probability and magnitude of losing capital in a way that cannot be recovered within your investment horizon.
These are related concepts, but they are not the same thing. Understanding where they overlap — and where they diverge — is foundational to smarter portfolio construction. For a deeper comparison of how different asset classes handle both dimensions, see how stocks, bonds, and real estate differ in their risk profiles.
Myth
If an investment is volatile, it is inherently risky — and the more it swings, the more dangerous it is.
Fact
Volatility describes price movement; risk describes the likelihood of permanent capital loss. High volatility does not automatically mean high risk over an appropriate time horizon.
Standard deviation — the most common measure of volatility — tells you how much an asset's returns have historically varied. It says nothing about whether those variations lead to lasting losses. Equities have historically shown high short-term volatility while delivering positive real returns over multi-decade periods. The price swings were real; the permanent loss was not. Risk, properly understood, also incorporates factors like default probability, liquidity constraints, inflation erosion, and behavioral pitfalls — none of which volatility alone captures.
Myth
Low-volatility assets are safe for all investors, regardless of their goals.
Fact
A low-volatility asset can be a high-risk choice if it fails to meet an investor's required return, eroding purchasing power over time.
Cash equivalents and short-duration fixed-income instruments exhibit minimal price fluctuation — but for a 35-year-old building a retirement portfolio, heavy allocation to these instruments may represent a serious long-term risk. Inflation quietly erodes real purchasing power; if portfolio returns fail to keep pace, the investor's future financial security is genuinely impaired. That is a form of risk that no standard deviation figure flags. The differences between low and high-risk investments go well beyond expected returns.
Myth
A sharp price drop means an investment has become riskier and should be sold.
Fact
Price declines often reduce forward-looking risk by creating a lower entry price, not increase it. Selling after a decline can lock in a permanent loss.
When equity prices fall, investors who equate volatility with risk frequently sell — doing the opposite of what valuation logic supports. Lower prices, all else equal, imply higher expected future returns for new buyers and a reduced risk of further meaningful loss for patient holders. Behavioral finance research consistently identifies this pattern — selling into declining markets — as one of the largest destroyers of investor returns. The price movement created discomfort; the decision to sell created the real financial damage.
Myth
Volatility measures comprehensively capture investment risk — the higher the standard deviation, the riskier the investment.
Fact
Standard deviation is one partial measure of one dimension of risk. It omits liquidity risk, credit risk, concentration risk, inflation risk, and behavioral risk.
Financial models routinely use standard deviation as a proxy for risk because it's quantifiable and mathematically tractable — not because it's comprehensive. An asset with modest standard deviation can carry significant credit risk (the issuer may default), liquidity risk (it may be difficult to exit when needed), or concentration risk (it may be correlated with other holdings in ways that aren't apparent). Risk tolerance, risk capacity, and risk perception are three distinct dimensions that shape the full picture. Relying exclusively on a volatility metric leaves significant blind spots. For assets with extreme volatility, understanding what structurally drives that movement is essential — crypto markets illustrate this clearly.
The Role of Time Horizon in Separating the Two Concepts
The most powerful variable that separates volatility from risk is time. An asset that swings violently in the short term may present minimal real risk to an investor who won't need access to those funds for 20 years. Conversely, a low-volatility asset — a short-duration bond or a money market fund — can represent significant risk to a long-term investor who needs growth to outpace inflation but forgoes it in the name of "safety."
This is why identical assets carry different risk profiles for different people. Time horizon fundamentally reshapes the risk-return equation in ways that no snapshot volatility measure can capture.
~10%
Average annual return of the S&P 500 (nominal, long-run historical)
Despite frequent sharp drawdowns, long-run historical data on the S&P 500 shows average nominal annual returns of approximately 10%, illustrating that short-term volatility has not equated to long-term loss for patient investors.
~1.5%
Average annual return gap: investor vs. fund performance
Research by Morningstar has repeatedly found that the average investor earns meaningfully less than the funds they invest in — a gap driven largely by poorly timed buying and selling in response to short-term price swings.
Investors also need to distinguish between their emotional tolerance for seeing a portfolio decline temporarily and their financial capacity to absorb an actual loss. These are different constraints. Risk tolerance and risk capacity are not the same, and allowing one to substitute for the other can produce portfolios misaligned with real-world financial needs.
Further, conflating volatility with risk produces a specific and costly behavioral error: panic selling during market downturns. When prices fall sharply, investors who equate price movement with permanent loss are most likely to liquidate positions — realizing losses that would have been temporary had they stayed invested. This converts a paper decline into a real one, and removes the portfolio from the subsequent recovery. For an exploration of how these analytical errors compound, see common errors that distort risk perception.
This article is for general informational and educational purposes only and does not constitute personalized investment, financial, tax, or legal advice. All investments involve risk, including the possible loss of principal. Past performance does not guarantee future results. Readers should consult a qualified financial adviser before making decisions specific to their circumstances.

Author
Investing Fundamentals Editorial Team
Investing Fundamentals Editorial Team is the collective byline for our editorial team and contributor network. Articles published under this byline or an editorial pen name are researched, written, and reviewed according to our editorial standards for clarity, consistency, and independence before publication.
View all articles →