
Stocks, Bonds, and Real Estate: How Their Risk Profiles Actually Differ
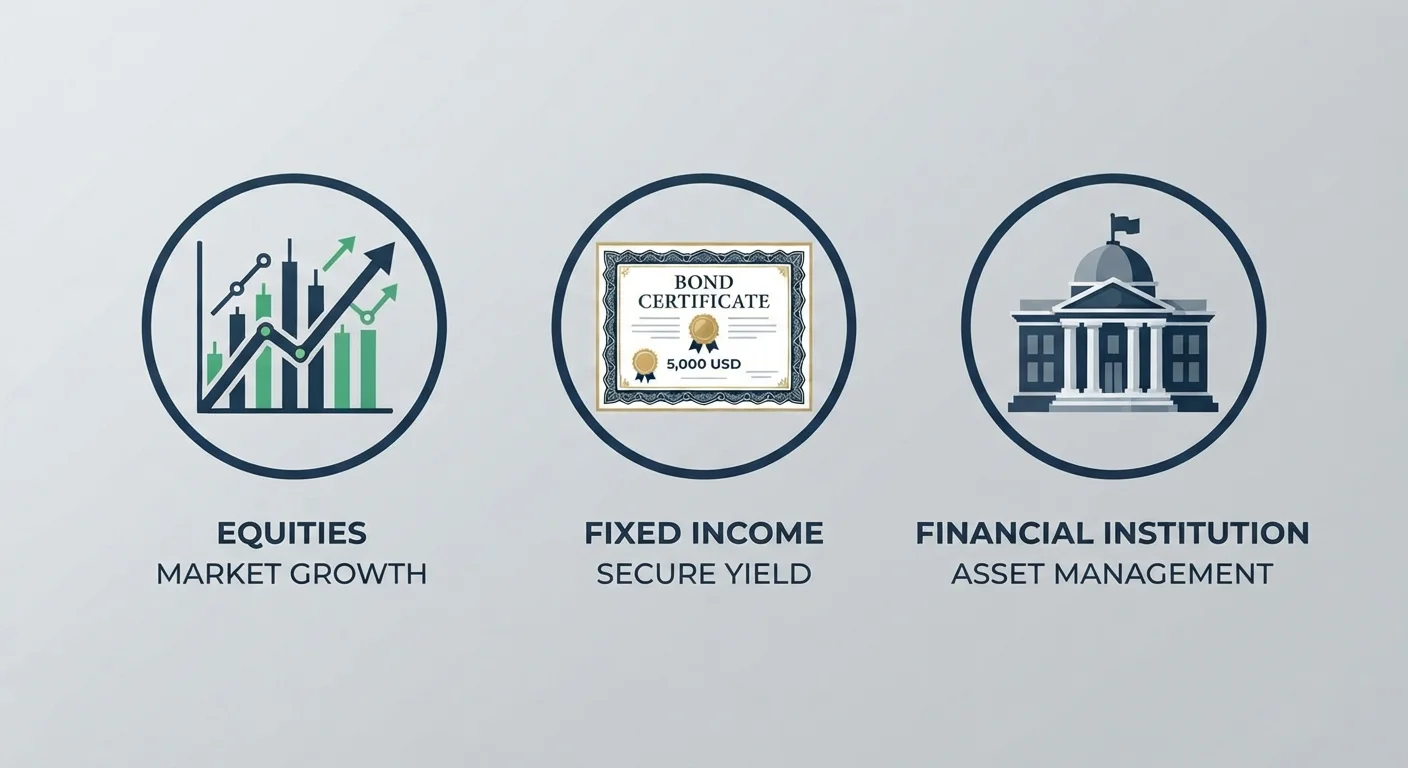
Photo credit: NewBizBuzz.net | Financial Insights For All
In this article
Volatility, liquidity, and loss potential vary widely across asset classes. Here's how the three core types measure up against each other.
Key Takeaways
- Stocks offer the highest long-term return potential but carry the greatest short-term price volatility among the three core asset classes.
- Bonds provide more predictable income and lower volatility, but face interest rate risk and inflation erosion over time.
- Real estate delivers income and inflation protection but introduces illiquidity and concentration risk not present in publicly traded assets.
- Liquidity — how quickly you can convert an asset to cash without loss — differs dramatically across all three classes.
- Each asset class serves a distinct portfolio role; understanding their risk profiles helps investors allocate more intentionally.
Why Risk Profiles Matter Before Anything Else
Most investors begin by asking what an asset might return. A more instructive starting point is understanding what it might lose — and under what circumstances. Risk is multidimensional: it encompasses price volatility, the possibility of permanent capital loss, liquidity constraints, and sensitivity to macroeconomic forces like inflation and interest rates.
Stocks, bonds, and real estate are the three pillars of most diversified portfolios, yet their risk profiles differ in ways that go well beyond the familiar "stocks are risky, bonds are safe" shorthand. For a deeper grounding in what each asset class is and how it behaves structurally, see The Major Asset Classes Every Investor Should Understand. This article focuses specifically on where — and why — their risk characteristics diverge.
Understanding these differences isn't just academic. It directly informs how much of each asset class belongs in a portfolio and how that allocation should shift as goals, income needs, and time horizons evolve.
Stocks: High Volatility, High Return Potential
Equities represent ownership stakes in businesses. When a company prospers, stockholders benefit through price appreciation and dividends. When it struggles — or when broader market sentiment deteriorates — share prices can fall sharply and quickly. That sensitivity to both company-specific and market-wide forces makes stocks the most volatile of the three core classes.
Historically, US equities have produced higher long-run returns than bonds or cash, but investors pay for that premium with significant short-term drawdowns. Major indices have experienced peak-to-trough declines exceeding 40% during recessions and financial crises. Individual stocks can lose far more, or go to zero — a risk that broad diversification reduces but does not eliminate. Systematic and unsystematic risk explain why some of that volatility cannot be diversified away regardless of how many stocks you hold.
Liquidity is a genuine advantage: publicly listed shares can typically be sold within seconds at market price. But as this analysis of volatility vs. risk explains, the ease of selling can become a liability — enabling panic selling at precisely the wrong moment.
~10%
Average annual US equity return (nominal)
Long-run data from sources such as Ibbotson/Morningstar suggest US large-cap stocks have returned roughly 10% annually before inflation, though individual periods vary dramatically.
40%+
S&P 500 peak-to-trough decline in major downturns
The 2008–2009 financial crisis and the 2000–2002 dot-com bust each saw US equity indices fall more than 40% from peak to trough, illustrating equity downside risk.
5–10%
Typical real estate transaction cost
Selling a property in the US typically incurs agent commissions, closing costs, and taxes that together can consume 5–10% of sale value, a major liquidity barrier.
Bonds: Lower Volatility, But Not Risk-Free
Bonds are debt instruments: the investor lends capital to a government or corporation in exchange for periodic interest payments and the return of principal at maturity. That contractual structure makes bond returns more predictable than equity returns — but predictable is not the same as safe.
Interest rate risk is bonds' most significant structural vulnerability. When prevailing rates rise, existing bond prices fall, because newly issued bonds offer better terms. A long-duration bond — one maturing in 20 or 30 years — can lose a meaningful portion of its market value in a rising rate environment. Inflation risk compounds this: if inflation outpaces a bond's coupon rate, the investor's real purchasing power erodes even while nominal payments arrive on schedule.
Credit risk varies by issuer. US Treasury bonds carry negligible default risk; high-yield ("junk") corporate bonds carry considerably more. The classic stocks vs. bonds trade-off is often framed as growth vs. stability, but the real picture is more nuanced — bond safety is duration- and credit-dependent, not inherent.
| Stocks | Bonds | Real Estate | |
|---|---|---|---|
| Price Volatility | High — frequent short-term swings | Low to moderate — rate-sensitive | Low reported, but illiquid |
| Liquidity | Very high — sell in seconds | High for Treasuries, lower for others | Low — weeks or months to sell |
| Primary Risk Factor | Market and company performance | Interest rate and credit risk | Illiquidity and leverage |
| Inflation Protection | Partial — earnings can grow | Weak — fixed coupons erode | Strong — rents often rise with CPI |
| Income Generation | Variable — dividends not guaranteed | Predictable — contractual coupons | Variable — rent minus expenses |
| Long-Run Return Potential | Highest historically | Lower, more stable | Moderate, leverage-dependent |
| Typical Portfolio Role | Growth engine | Stabilizer and income source | Diversifier and inflation hedge |
Real Estate: Illiquid, Leveraged, and Inflation-Linked
Real estate introduces a risk profile that differs structurally from both stocks and bonds. Physical property is illiquid: selling takes weeks or months, involves transaction costs typically ranging from 5–10% of value, and requires a willing buyer at a fair price. This illiquidity cuts both ways — it discourages panic selling but also makes it harder to rebalance or exit a position when circumstances change.
Real estate is also typically acquired with leverage (mortgage financing), which amplifies both gains and losses. A property purchased with 20% down and financed at 80% means a 25% decline in property value could wipe out the entire equity stake. Concentration risk is another factor: a single property represents a large, undiversified exposure to one location, one property type, and one tenant base.
On the positive side, real estate has historically provided a degree of inflation protection — rents and property values often rise alongside general price levels over long periods, which bonds cannot claim. REITs (Real Estate Investment Trusts) offer a more liquid route to real estate exposure but carry different risk characteristics; physical property vs. REITs breaks down those distinctions in detail.
Consider Your True Liquidity Needs First
Before allocating to real estate or long-duration bonds, map out when you may need to access capital. Assets that are difficult or expensive to sell quickly can create serious constraints during life events or market dislocations. Building a liquid reserve in more accessible assets first gives illiquid positions room to work over the time horizons they require.
Putting the Three Together: Portfolio Role and Correlation
The value of comparing risk profiles isn't to identify a winner — it's to understand how each class contributes differently to a portfolio's overall behavior. Stocks drive long-run growth but increase short-term variability. Bonds reduce volatility and generate income, functioning as a buffer during equity drawdowns. Real estate adds inflation linkage and income diversification, with low correlation to public markets under normal conditions.
How these assets move relative to each other matters as much as how they move individually. Correlation between asset classes determines whether combining them actually reduces portfolio risk — and that correlation can shift during market stress. For investors wanting to contextualize these three classes against a broader universe including alternatives and cash, asset classes ranked by historical risk profile provides useful context.
Ultimately, the right mix depends on factors that differ by individual: time horizon, income requirements, tax situation, and genuine — not hypothetical — tolerance for loss. Consult a licensed financial adviser before making allocation decisions specific to your circumstances. Past performance of any asset class does not guarantee future results.
This article is for general informational and educational purposes only and does not constitute personalized financial, investment, tax, or legal advice. All investments involve risk, including the possible loss of principal. Consult a qualified financial professional before making decisions about your own portfolio.

Author
Investing Fundamentals Editorial Team
Investing Fundamentals Editorial Team is the collective byline for our editorial team and contributor network. Articles published under this byline or an editorial pen name are researched, written, and reviewed according to our editorial standards for clarity, consistency, and independence before publication.
View all articles →