
Sector Rotation: Tracking How Money Moves Across the Market Cycle
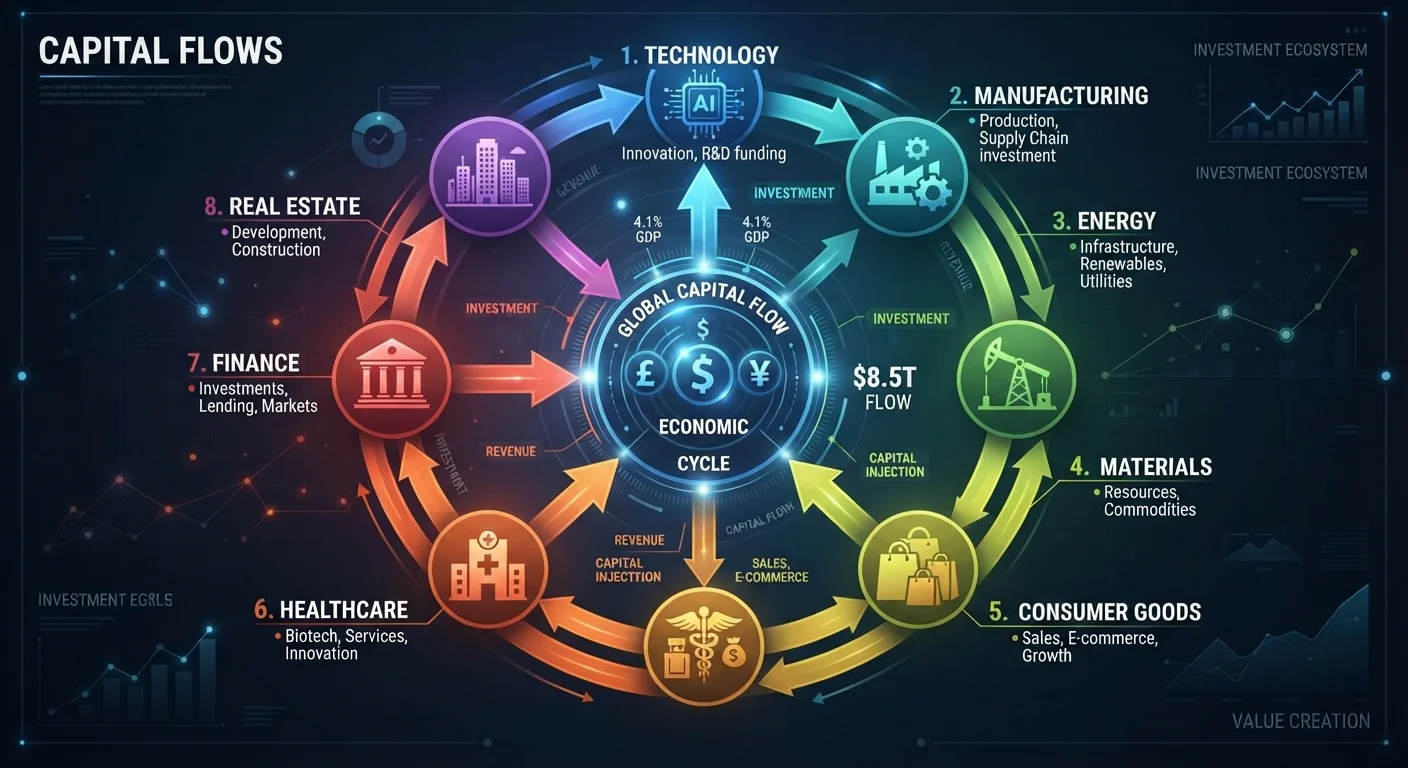
Photo credit: NewBizBuzz.net | Financial Insights For All
In this article
Sector rotation describes how capital flows between industries as economic conditions change. Understand the logic behind the cycle and how analysts read it.
Key Takeaways
- Sector rotation reflects how capital shifts between industries as economic conditions change through a predictable cycle.
- Different sectors tend to lead or lag at distinct phases: early expansion, mid-cycle, late cycle, and recession.
- Analysts use relative strength data, earnings trends, and macroeconomic indicators to identify rotation in progress.
- Sector rotation is observable in hindsight but notoriously difficult to time with precision in real time.
- Understanding rotation helps investors contextualize market movements, not just react to daily price noise.
Why Capital Doesn't Stay Still
Markets are not monolithic. At any given moment, some industries are gaining investor attention while others are quietly losing it — not because of company-specific news, but because the broader economic backdrop is shifting. This dynamic is called sector rotation, and understanding it is fundamental to reading market behavior beyond individual stock moves.
The logic is straightforward: different sectors are sensitive to different economic conditions. Technology and consumer discretionary companies tend to prosper when growth is accelerating and credit is cheap. Energy producers benefit when demand surges and commodity prices rise. Utilities and consumer staples, by contrast, attract capital when growth slows and investors prioritize stability over upside.
Because these sensitivities are fairly consistent, the movement of capital across sectors tends to follow recognizable patterns across successive business cycles. Analysts who understand this framework can better interpret what the market is signaling about where the economy stands — and where it may be heading. For broader context on how different asset classes behave through these phases, see how asset classes tend to behave at different points in the economic cycle.
The Four-Phase Framework
Most sector rotation models are built around a four-phase business cycle: early expansion, mid-cycle growth, late cycle, and recession. Each phase historically favors distinct sectors.
- Early expansion: As the economy emerges from a downturn, consumer confidence recovers and credit conditions ease. Financials, consumer discretionary, and industrials typically lead, benefiting from pent-up demand and improving lending conditions.
- Mid-cycle: Growth is broad-based and earnings are rising across many industries. Technology and communication services often outperform as businesses invest in capacity and innovation.
- Late cycle: Growth begins to slow, inflation may be elevated, and central banks are often tightening monetary policy. Energy and materials tend to outperform as commodity prices peak; defensive sectors start attracting flows.
- Recession: Economic activity contracts. Healthcare, utilities, and consumer staples — sectors with inelastic demand — hold relative value while cyclical sectors decline.
This framework is a map, not a timetable. Cycles vary considerably in duration and intensity, and the boundaries between phases are rarely clear in real time. Still, the model provides a useful analytical lens for contextualizing sector performance data.
11
GICS sectors in the S&P 500
The Global Industry Classification Standard (GICS) divides the S&P 500 into 11 sectors, providing the structural foundation for most sector rotation analysis.
~5–7 years
Average US business cycle length (post-WWII)
According to the National Bureau of Economic Research (NBER), post-World War II US business cycles have averaged roughly five to seven years peak to peak, though individual cycles vary widely.
20–30%
Typical performance spread between best and worst sector
In many calendar years, the performance gap between the top- and bottom-performing S&P 500 sectors has ranged from roughly 20 to 30 percentage points, illustrating the practical significance of sector allocation.
How Analysts Read Rotation Signals
Identifying sector rotation requires layering multiple data sources rather than relying on any single indicator. Several analytical tools are widely used by professional market observers.
Relative strength analysis compares a sector's price performance to the broader index over time. A sector consistently outpacing the S&P 500, for example, signals that capital is actively flowing into it — an early marker of rotation.
Fund flow data tracks money moving into and out of sector-specific exchange-traded funds and mutual funds. Sustained inflows into a given sector over multiple weeks can indicate institutional positioning, not just short-term trading noise.
Earnings revision trends show whether analysts are upgrading or downgrading sector-level earnings estimates. Broad upward revisions in a sector often reflect improving underlying business conditions that attract new capital.
Leading economic indicators — such as the yield curve, purchasing managers' indices (PMIs), and housing starts — help place current conditions within the business cycle context. Mapping these indicators against sector performance helps analysts anticipate, rather than simply react to, rotation.
“The stock market is not the economy, but the economy eventually shows up in the stock market. Sector rotation is often where you see that relationship play out most clearly.”
— Howard Marks, Co-founder of Oaktree Capital Management and author of 'The Most Important Thing'
For a structured approach to incorporating these signals into a broader market analysis process, the complete market analysis framework covers how macro context, sector dynamics, and stock selection interact.
What Rotation Analysis Can and Cannot Tell You
Sector rotation is a powerful interpretive tool, but it has meaningful limitations that analysts are candid about. Markets are forward-looking, meaning rotation often occurs well before economic data confirms a phase transition. By the time a cycle shift is visible in GDP reports or earnings, institutional money has frequently already moved.
This creates a practical challenge: the most actionable rotation signals are also the least certain. Early signs of rotation can reverse quickly if macroeconomic conditions shift unexpectedly — an abrupt policy change, geopolitical event, or credit shock can truncate a cycle phase that appeared to be unfolding predictably.
Use Rotation as Context, Not a Timer
Sector rotation frameworks are most useful for understanding where the market may be in the cycle — not for making precise buy or sell decisions. Analysts recommend using rotation signals alongside valuation analysis and company fundamentals rather than in isolation. Sector-specific valuation metrics can help sharpen judgments once a rotation thesis is identified.
Additionally, sector definitions are imperfect. Large conglomerates straddle multiple industries, which can dilute the purity of sector-level signals. Understanding how to interpret company-level segment data is a useful complement to top-down rotation analysis — see how segment reporting changes how you evaluate conglomerates for more on this.
Used appropriately, sector rotation analysis helps investors understand why markets are behaving as they are, not just what prices are doing. It is a framework for clarity, not a system for predicting the future. For a deeper look at rotation as an active investing approach — including its execution challenges — see sector rotation as an investment approach.
This article is for informational and educational purposes only and does not constitute personalized investment advice. Consult a qualified financial adviser before making investment decisions based on your individual circumstances.
Frequently Asked Questions

Author
Stocks & Markets Editorial Team
Stocks & Markets Editorial Team is the collective byline for our editorial team and contributor network. Articles published under this byline or an editorial pen name are researched, written, and reviewed according to our editorial standards for clarity, consistency, and independence before publication.
View all articles →