
Stocks vs. Bonds: Understanding the Classic Portfolio Trade-Off
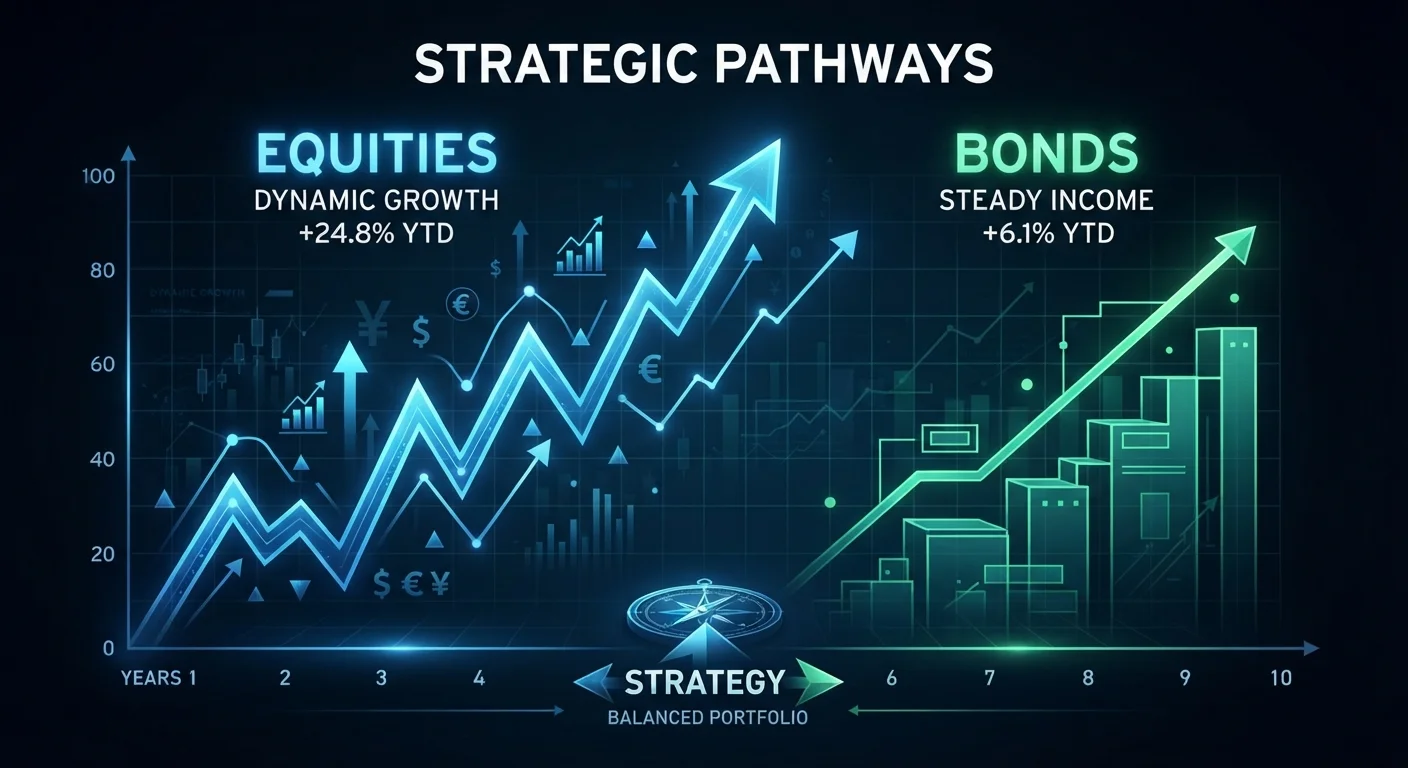
Photo credit: NewBizBuzz.net | Financial Insights For All
In this article
The balance between equities and fixed income sits at the core of portfolio theory. Here's how the two asset classes complement — and compete with — each other.
Key Takeaways
- Stocks offer higher long-run return potential but carry significantly greater short-term price volatility than bonds.
- Bonds provide predictable income streams and tend to preserve capital better during equity market downturns.
- The two asset classes have historically shown low or negative correlation, making them natural portfolio complements.
- Allocation between stocks and bonds is not static — it should reflect time horizon, risk tolerance, and financial goals.
- Neither asset class is inherently superior; their value lies in how they interact within a diversified portfolio.
- This article provides general financial education, not personalized investment advice. Consult a licensed financial adviser for guidance specific to your situation.
What Each Asset Class Actually Is
Before comparing their behavior, it helps to be precise about what stocks and bonds represent structurally. A stock (or equity) is an ownership stake in a company. Shareholders participate in the firm's growth through capital appreciation and, in some cases, dividends — but they also absorb losses if the company underperforms or fails. Returns are neither fixed nor guaranteed.
A bond is a debt instrument. When you purchase a bond, you are lending money to a government, municipality, or corporation in exchange for periodic interest payments (called coupon payments) and the return of principal at maturity. The income stream is contractually defined, though credit risk — the chance the issuer defaults — and interest rate risk still apply.
For a deeper look at how these and other asset classes fit into the broader investment universe, see The Major Asset Classes Every Investor Should Understand.
| Criterion | Stocks (Equities) | Bonds (Fixed Income) |
|---|---|---|
| Investor role | Partial owner of the company | Creditor / lender to issuer |
| Primary return source | Capital appreciation, dividends | Coupon (interest) payments, return of principal |
| Income predictability | Variable; dividends not guaranteed | Fixed contractual payments (unless issuer defaults) |
| Volatility (typical) | Higher — larger price swings | Lower — more stable price behavior |
| Long-run return potential | Historically higher | Historically lower |
| Capital preservation | No guarantee; can lose substantial value | Stronger (investment-grade); principal returned at maturity |
| Interest rate sensitivity | Indirect — affects valuations via discount rates | Direct — rising rates reduce bond prices |
| Recession behavior | Typically declines with corporate earnings | Government bonds often hold or gain value |
| Best suited for | Long-term growth-oriented investors | Income needs, capital preservation, diversification |
Risk, Return, and the Correlation That Makes Diversification Work
The stocks-vs-bonds trade-off is fundamentally a risk-return conversation. Equities have historically delivered higher long-run returns than investment-grade bonds, but that premium comes with considerably greater volatility — measured by the magnitude and frequency of price swings. During bear markets, equity drawdowns can be severe and sustained.
Bonds, by contrast, tend to lose less value during recessions and equity sell-offs. More importantly, high-quality government bonds have historically shown a low or negative correlation with equities during periods of market stress — meaning they often hold their value or appreciate when stocks fall. This negative correlation is the mechanical basis for portfolio diversification: combining assets that don't move together reduces total portfolio volatility without proportionally reducing expected return.
~10%
US equity annualized nominal return (long-run historical)
US large-cap equities have delivered approximately 10% annualized nominal returns over long historical periods, per widely cited research including the Ibbotson SBBI data series — though past performance does not guarantee future results.
~5%
US long-term government bond historical nominal return
Long-term US government bonds have historically returned roughly 5% annually in nominal terms over comparable periods, reflecting their lower risk profile relative to equities.
60/40
Classic stock-bond portfolio split
The 60% stocks / 40% bonds allocation has been a widely referenced benchmark for balanced portfolios, historically offering a blend of growth potential and volatility mitigation.
It's worth noting that the correlation between stocks and bonds is not fixed. In inflationary environments, both asset classes can fall simultaneously — as seen in certain periods where rising interest rates suppressed bond prices while also weighing on equity valuations. Understanding how that relationship shifts under different macroeconomic conditions is an important layer of portfolio literacy. See how these risk profiles actually differ for a broader risk comparison.
How Allocation Between the Two Shapes Portfolio Behavior
The ratio of stocks to bonds in a portfolio is one of the most consequential decisions in portfolio construction. A higher equity allocation tilts the portfolio toward growth and increases short-term volatility; a higher bond allocation favors stability and income at the cost of long-run appreciation potential.
Traditional allocation frameworks — such as the age-based heuristic of holding your age as a percentage in bonds — offer starting points, but they are blunt instruments. More rigorous approaches consider time horizon, income needs, liquidity requirements, and the investor's genuine capacity to tolerate drawdowns (not just their stated preference). The Portfolio Basics hub covers these construction principles in detail.
Portfolio rebalancing also matters here. As equities grow, they can drift to represent a larger share of the portfolio than intended, increasing risk exposure beyond the investor's target. Periodic rebalancing — selling some equities and adding to bonds when equities have outperformed — restores the intended risk profile. For a nuanced look at how bonds function within equity-heavy portfolios specifically, see The Role of Bonds in a Stock-Heavy Portfolio.
The 60/40 Portfolio: Still Relevant?
The classic 60% equities / 40% bonds portfolio has served as a benchmark for balanced investors for decades. Its appeal rests on the historically negative correlation between the two asset classes during equity downturns. However, periods of high inflation — such as those experienced in the early 2020s — demonstrated that bonds can lose value alongside equities when interest rates rise sharply, challenging the portfolio's diversification logic. This doesn't invalidate the framework, but it does highlight that asset allocation assumptions deserve periodic re-examination as macroeconomic conditions evolve.
This article is for general informational and educational purposes only and does not constitute personalized investment, financial, tax, or legal advice. All investing involves risk, including the possible loss of principal. Past performance does not guarantee future results. Please consult a qualified, licensed financial adviser before making investment decisions specific to your situation.

Author
Investing Fundamentals Editorial Team
Investing Fundamentals Editorial Team is the collective byline for our editorial team and contributor network. Articles published under this byline or an editorial pen name are researched, written, and reviewed according to our editorial standards for clarity, consistency, and independence before publication.
View all articles →