
Income Statement Fundamentals: Revenue, Expenses, and What's Left Over
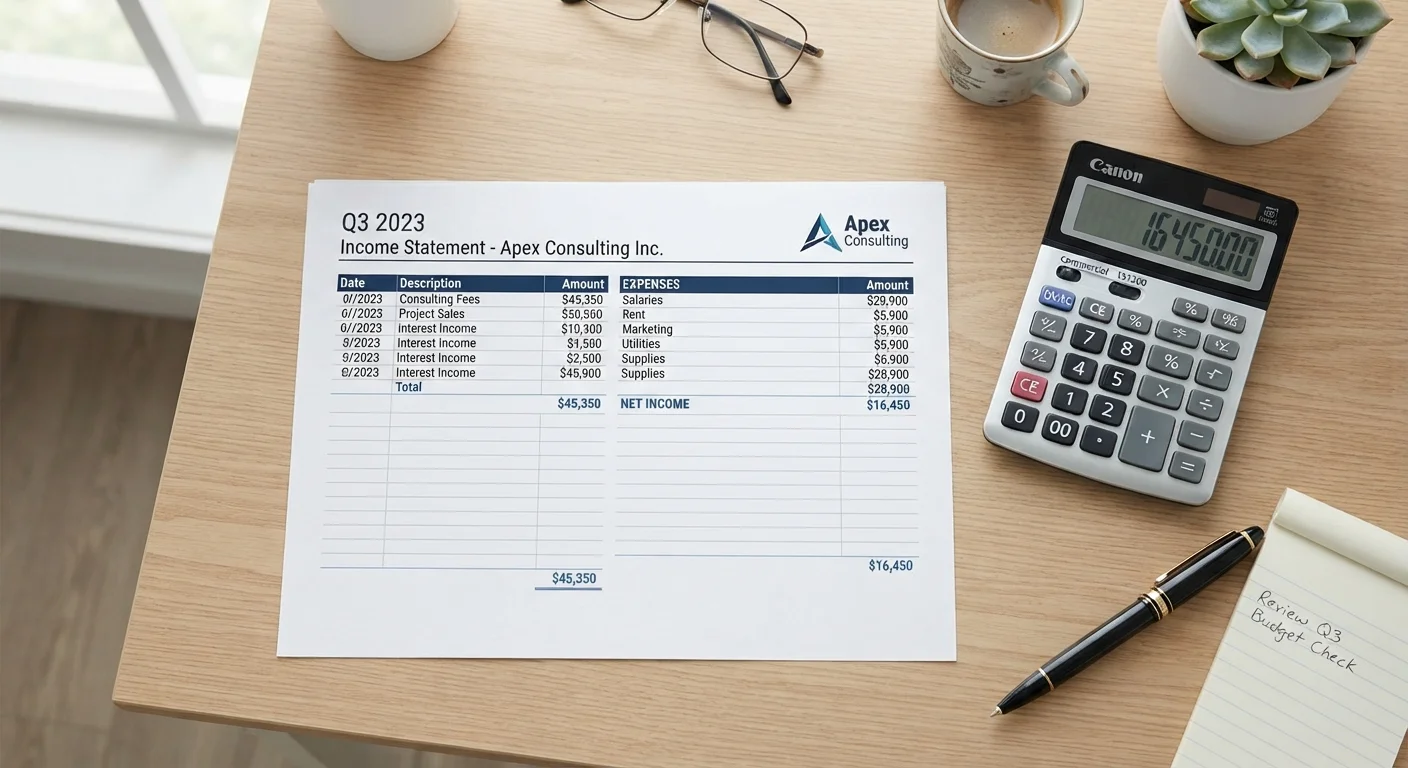
Photo credit: NewBizBuzz.net | Financial Insights For All
In this article
Learn how an income statement is structured, what gross profit and net income actually mean, and how to interpret the numbers you see.
Key Takeaways
- Revenue is recorded when earned, not necessarily when cash is received - a key accrual accounting principle.
- Gross profit reveals how efficiently a company produces its goods or services before overhead costs.
- Operating income strips out non-operating items to show core business performance.
- Net income is the bottom line, but it doesn't equal cash - profitable companies can still face liquidity problems.
- Reading the income statement alongside the balance sheet and cash flow statement gives a complete picture.
How the Income Statement Is Structured
The income statement is organized as a waterfall: each line subtracts a category of cost from the previous subtotal until you arrive at net income. The most common format - the multi-step income statement - breaks this journey into meaningful checkpoints rather than collapsing everything into a single calculation.
At the top sits revenue (sometimes called net sales or turnover), the total value of goods sold or services rendered during the period. From revenue, the cost of goods sold (COGS) is subtracted to produce gross profit. Operating expenses then reduce gross profit to operating income. Finally, non-operating items - interest income or expense, and income tax - bring you to net income.
This structure is part of the three core financial statements that together form a complete picture of a company's financial health.
80%+
Gross margin common in software businesses
Software companies frequently report gross margins above 80%, reflecting low variable costs relative to revenue - a benchmark often cited in industry financial analyses.
1-3%
Typical net margin in grocery retail
Grocery retailers routinely operate on net margins of 1-3%, underscoring how industry economics shape what counts as a strong income statement result.
3
Core financial statements under U.S. GAAP
U.S. GAAP requires public companies to present an income statement, balance sheet, and cash flow statement as part of their standard financial reporting package.
Revenue, COGS, and Gross Profit Explained
Revenue under accrual accounting is recognized when it is earned - when goods are delivered or services are performed - regardless of when payment is received. This distinction matters because a sale recorded today may not generate cash for weeks or months.
Cost of Goods Sold captures the direct costs tied to producing what was sold: raw materials, direct labor, and manufacturing overhead. For a service business, COGS often appears as cost of revenue and reflects direct service delivery costs.
Subtracting COGS from revenue yields gross profit. The gross profit margin - gross profit divided by revenue - is a critical efficiency metric. A retailer with a 25% gross margin retains $0.25 from every dollar of sales before any overhead is paid. Comparing this margin over time, or against industry peers, quickly reveals whether a company's core economics are strengthening or eroding.
Operating Expenses, Operating Income, and the Path to Net Income
Operating expenses include selling, general, and administrative costs (SG&A), research and development, and depreciation and amortization. These are the costs of running the business beyond direct production. Subtracting them from gross profit produces operating income - sometimes called EBIT - which isolates core business performance from financing and tax decisions.
Below the operating line, non-operating items appear: interest expense on debt, interest income from investments, and gains or losses from asset sales. Subtracting these, along with income tax expense, yields net income - the celebrated "bottom line."
Net income is important, but it has limits. Because it includes non-cash charges and excludes cash movements from investing and financing, it can diverge significantly from actual liquidity. That divergence is exactly what cash flow vs. net income analysis is designed to expose.
Focus on Trends, Not Just One Period
A single income statement is a snapshot. Comparing three to five years of statements reveals whether revenue is growing, margins are compressing, or operating leverage is improving. Most SEC filings present two to three years of comparative data precisely for this reason.
Reading Income Statements Alongside Other Financial Reports
No single financial statement tells the complete story. The income statement measures performance over a period; the balance sheet captures financial position at a point in time. Understanding both together is essential - reading a balance sheet alongside the income statement reveals how profits translate into accumulated equity and asset growth.
Meanwhile, the income statement's net income figure can look healthy while operating cash generation is weak. The cash flow statement reveals the actual cash a business generates from operations - and why a profitable company can still run out of cash.
Once you're comfortable interpreting net income, the logical next step is examining profit vs. profitability ratios, which contextualize raw dollar figures against the capital deployed to generate them.
This article is for general informational and educational purposes only and does not constitute personalized financial, accounting, tax, or investment advice. Readers should consult a qualified financial professional or CPA for guidance specific to their circumstances.
Frequently Asked Questions

Author
Accounting & Tax Editorial Team
Accounting & Tax Editorial Team is the collective byline for our editorial team and contributor network. Articles published under this byline or an editorial pen name are researched, written, and reviewed according to our editorial standards for clarity, consistency, and independence before publication.
View all articles →