
Reading a Balance Sheet Without an Accounting Degree
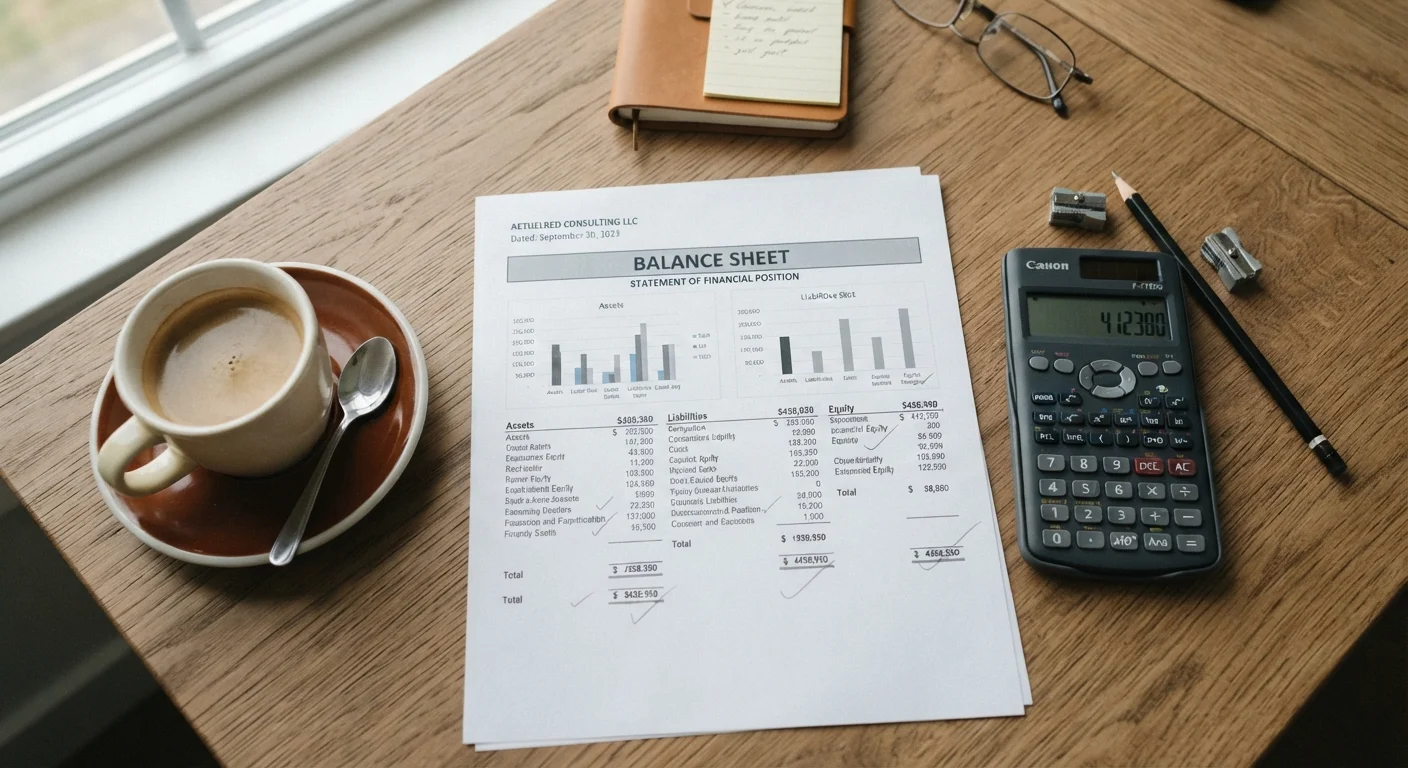
Photo credit: NewBizBuzz.net | Financial Insights For All
In this article
Break down the structure of a balance sheet — assets, liabilities, and equity — and learn what each section tells you about financial health.
Key Takeaways
- A balance sheet is a financial snapshot showing what a company owns, owes, and what remains for its owners.
- The fundamental accounting equation — Assets = Liabilities + Equity — must always hold true.
- Current assets and current liabilities reveal short-term financial health and liquidity.
- Equity represents the residual claim owners hold after all debts are settled.
- Key ratios like the current ratio and debt-to-equity ratio can be calculated directly from balance sheet data.
What a Balance Sheet Actually Is
A balance sheet is one of the three core financial statements issued by a company, alongside the income statement and cash flow statement. Unlike the income statement — which covers revenues and expenses over a period of time — the balance sheet captures a single moment in time, like a financial photograph taken at the close of a reporting period.
Its defining characteristic is a mathematical identity known as the accounting equation: Assets = Liabilities + Equity. This equation never breaks. Every entry on a balance sheet exists because of this relationship. For a deeper grounding in why this equation holds, see our piece on why every transaction balances.
Balance sheets appear in quarterly and annual filings for public companies, and any serious review of a company's financial position should begin here. They're also central to understanding how a business uses debt and capital — topics explored across our financial reporting hub.
Current Assets
Resources a company expects to convert into cash or use up within the next 12 months, such as cash, receivables, and inventory.
Non-Current Assets
Long-term resources like property, equipment, and intangible assets that provide value over multiple years.
Current Liabilities
Financial obligations the company must settle within 12 months, including short-term debt and amounts owed to suppliers.
Retained Earnings
Cumulative net profits kept inside the business over time rather than distributed to shareholders as dividends.
Shareholders' Equity
The residual value belonging to owners after all liabilities are subtracted from total assets — also called net worth or book value.
Liquidity
A company's ability to meet its short-term financial obligations using readily available assets like cash and receivables.
Assets: What the Company Controls
The asset side of the balance sheet lists everything of economic value the company controls. Assets are typically organized into two buckets: current assets and non-current assets.
Current assets are those expected to be converted to cash within 12 months. They include cash and cash equivalents, accounts receivable (money owed by customers), inventory, and short-term investments. High current assets relative to liabilities generally indicate good liquidity.
Non-current assets — also called long-term assets — include property, plant, and equipment (PP&E), intangible assets like patents and goodwill, and long-term investments. These are the resources that support operations over multiple years.
Check the Date on the Balance Sheet
Always note the 'as of' date at the top of a balance sheet before drawing conclusions. A balance sheet dated December 31 reflects year-end conditions that may differ significantly from mid-year. Seasonal businesses in particular can look very different from one reporting date to the next, so comparing the same period across multiple years is more meaningful than a single snapshot.
One common misread is treating total assets as equivalent to value. A company can carry heavily depreciated assets on its books at a fraction of their replacement cost, or carry goodwill that reflects a premium paid in a past acquisition. Context matters, and balance sheet literacy dives deeper into each line item.
Liabilities: What the Company Owes
Liabilities represent financial obligations — debts and commitments the company must settle in the future. Like assets, they split into current and non-current categories.
Current liabilities are due within 12 months and include accounts payable (amounts owed to suppliers), short-term debt, accrued expenses, and the current portion of long-term debt. Watching current liabilities closely helps gauge how much pressure the company faces in the near term.
Non-current liabilities cover long-term debt, lease obligations, deferred tax liabilities, and pension commitments. These are obligations that extend beyond the next year and often carry interest costs that affect earnings over time.
High Liabilities Aren't Always a Red Flag
A large liability balance isn't automatically alarming — context is essential. Capital-intensive industries like manufacturing, utilities, and real estate routinely carry significant long-term debt as a normal part of operations. What matters most is whether the company generates sufficient cash flow to service those obligations comfortably over time. Assessing liabilities without reviewing the income statement or cash flow statement can lead to misreading a company's true financial position.
Investors should also be aware that not all obligations appear directly on the balance sheet. Operating leases and contingent liabilities can be tucked into footnotes. Our guide on off-balance-sheet items explains what to look for beyond the reported figures.
Equity: What's Left for Owners
Equity — sometimes called shareholders' equity or net worth — is the residual interest in assets after all liabilities are subtracted. In practical terms, it answers: if the company liquidated everything and paid off all debts, what would remain for shareholders?
Equity typically includes common stock (the par value of shares issued), additional paid-in capital (amounts received above par), retained earnings (cumulative profits kept in the business rather than paid out as dividends), and sometimes treasury stock (shares the company has repurchased).
Retained earnings are a particularly informative figure — they represent accumulated profit not distributed to shareholders. A steady growth in retained earnings over time is often a sign of a company that generates consistent profits and reinvests them. This data underpins valuation analysis; for a structured path into that topic, see equity valuation from the ground up.
Reading Key Ratios from the Balance Sheet
Once you understand the three sections, a few ratios transform raw numbers into actionable insight.
- Current Ratio = Current Assets ÷ Current Liabilities. A ratio above 1.0 generally indicates the company can meet short-term obligations. Below 1.0 raises liquidity concerns.
- Debt-to-Equity Ratio = Total Liabilities ÷ Total Equity. This measures financial leverage. A higher ratio means more debt relative to owner capital, which amplifies both potential returns and risk.
- Book Value per Share = Total Equity ÷ Shares Outstanding. This figure is compared against market price to calculate the price-to-book ratio, a common valuation metric.
No single ratio tells the whole story. Industry norms vary widely — a utility company will carry far more debt than a software firm without that being a red flag. Always compare ratios against peers and historical trends.
The balance sheet is just one piece of the puzzle. Pair it with the income statement and cash flow statement for a complete view. For a comprehensive walkthrough of how all financial statements fit together within a company's annual filing, our guide to reading an annual report is a natural next step.
This article is for general informational and educational purposes only and does not constitute personalized financial, investment, accounting, or legal advice. Readers should consult a qualified financial adviser, CPA, or other licensed professional before making decisions based on their individual circumstances.
Frequently Asked Questions

Author
Accounting & Tax Editorial Team
Accounting & Tax Editorial Team is the collective byline for our editorial team and contributor network. Articles published under this byline or an editorial pen name are researched, written, and reviewed according to our editorial standards for clarity, consistency, and independence before publication.
View all articles →