
Moving Averages: When the Simple Line Tells a Complicated Story
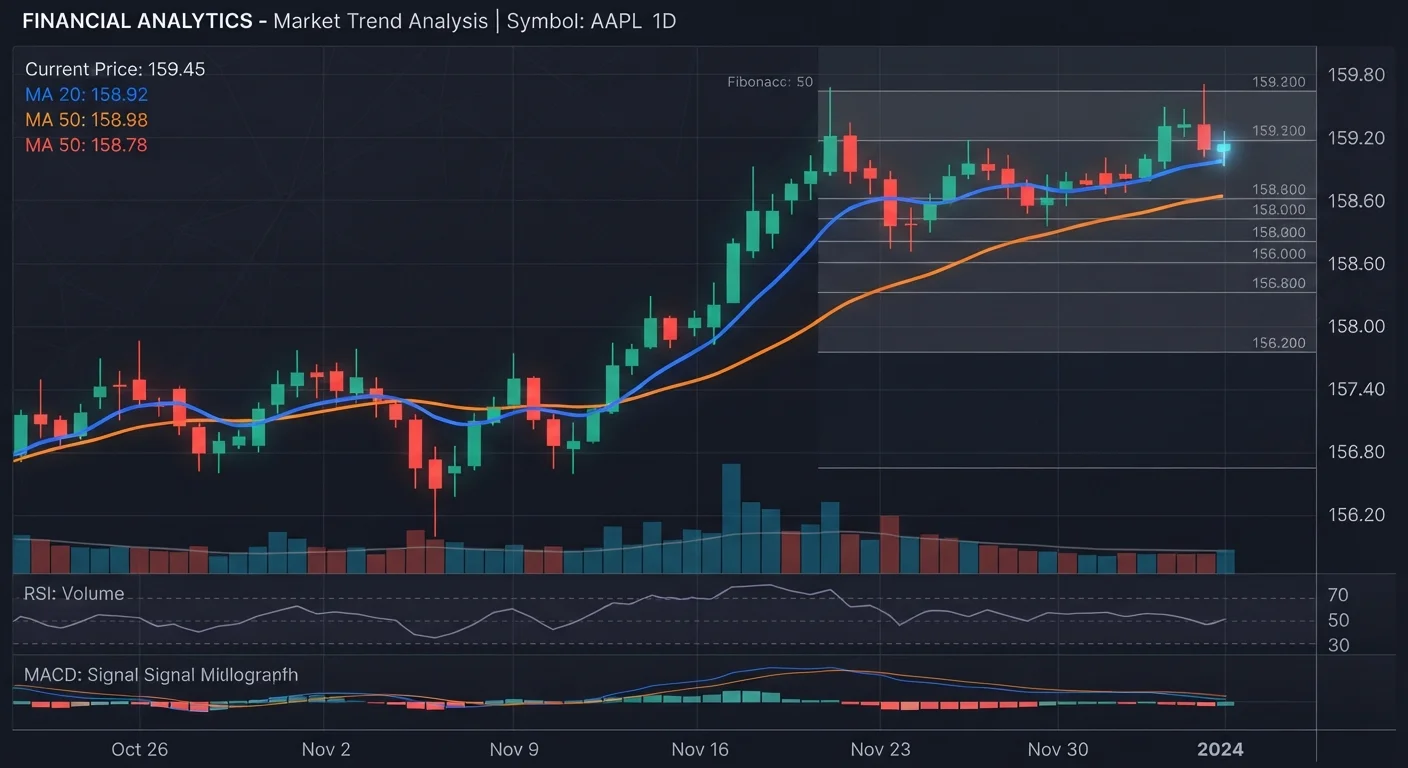
Photo credit: NewBizBuzz.net | Financial Insights For All
In this article
Moving averages smooth out price noise, but choosing the wrong type or period can mislead you. Learn how SMA and EMA differ and when each applies.
Key Takeaways
- The Simple Moving Average (SMA) weights all periods equally; the Exponential Moving Average (EMA) weights recent prices more heavily.
- Shorter moving average periods (e.g., 10-day) are more sensitive to price changes; longer periods (e.g., 200-day) reveal broader trends.
- Moving averages are lagging indicators — they confirm trends rather than predict reversals.
- Crossover signals (such as the 'golden cross') are widely followed but can produce false signals in choppy markets.
- Using moving averages in combination with volume or other indicators generally produces more reliable analysis.
What a Moving Average Actually Measures
At its core, a moving average answers one question: what has the average price been over a given window of time? By anchoring current price action to its recent history, it separates meaningful trend movement from random day-to-day noise. That smoothing function is genuinely useful — but it comes with a critical caveat: because it is built entirely from past data, a moving average always lags reality.
This lag is not a flaw to be fixed; it is an inherent property of the tool. Understanding it prevents the most common misuse — treating a moving average line as a forward-looking forecast rather than a backward-looking summary.
Moving Averages Are Lagging, Not Leading
Because moving averages are calculated entirely from historical price data, they confirm what has already happened rather than predicting what comes next. This distinction is important: a moving average can help verify that a trend is in place, but it cannot reliably signal the precise start or end of a price move. Treating it as a predictive tool rather than a confirmatory one is one of the most common analytical errors in technical analysis.
SMA vs. EMA: Two Different Perspectives on the Same Data
The two most widely used moving averages differ primarily in how they weight past prices.
The Simple Moving Average (SMA) treats every period in its lookback window as equally important. A 50-day SMA sums the closing prices of the past 50 days and divides by 50. Clean and transparent, the SMA is the preferred reference for analysts focused on long-run trend health — the 200-day SMA, for instance, is a widely cited gauge of whether a stock is broadly in an uptrend or downtrend.
The Exponential Moving Average (EMA) applies a weighting multiplier so that more recent prices carry greater influence. A 12-day EMA will respond noticeably faster to a sharp price move than a 12-day SMA covering the same window. This responsiveness makes the EMA popular among shorter-term traders who want early confirmation of momentum shifts — but it also makes the EMA more prone to reacting to short-lived noise.
Neither is inherently superior. The right choice depends on whether you prioritize responsiveness or stability, and on the timeframe you are analyzing. As covered in our guide to common technical analysis errors, conflating these two tools — or applying them without regard to market context — is a frequent source of analytical mistakes.
200-day
Most commonly cited long-term SMA benchmark
The 200-day Simple Moving Average is widely referenced by institutional analysts and financial media as a barometer of long-term trend direction for major equities and indices.
50-day
Standard intermediate-trend moving average
The 50-day moving average is commonly used alongside the 200-day to identify medium-term trend shifts, including the widely-watched golden cross and death cross patterns.
Crossovers, Periods, and the Risk of Oversimplification
Two applications of moving averages are especially common: trend identification and crossover signals.
For trend identification, the relationship between current price and a long-period moving average — often the 50-day or 200-day — provides a rough read on trend direction. A stock trading consistently above its 200-day SMA is generally considered to be in a long-term uptrend; sustained trading below it raises concern.
Crossover signals arise when a short-period average crosses a long-period one. The widely referenced golden cross — a 50-day SMA crossing above the 200-day SMA — has historically correlated with extended bullish periods in major indices, though it has also preceded false starts. Its inverse, the death cross, attracts similar scrutiny. The problem is that crossovers are reported after the fact; by the time the signal prints, a significant portion of the move may already have occurred.
Choosing the lookback period matters enormously. A 10-day EMA will whipsaw with every short-term fluctuation. A 200-day SMA may not register a meaningful trend change for weeks. There is no single correct period — the choice should align with the investment horizon being analyzed.
Match Your Period to Your Timeframe
Before selecting a moving average period, clarify the holding horizon you are analyzing. Short-term traders typically work with 10- to 20-period averages; longer-term investors commonly reference 50- or 200-period averages. Applying a short-period average to assess a long-term trend — or vice versa — introduces a mismatch that distorts interpretation.
Practical Application: Context Is Everything
Moving averages add the most analytical value when used alongside other signals, not in isolation. Volume confirmation, for example, helps distinguish a genuine breakout from a false one when price crosses a key moving average. Momentum oscillators can clarify whether a trend identified by an EMA actually has underlying strength.
Market environment matters just as much as indicator selection. In a strongly trending market, moving average signals tend to be cleaner and more reliable. In a sideways, range-bound environment, the price may repeatedly oscillate across the moving average, producing a stream of contradictory signals that carry little information.
It is also worth noting that moving average analysis differs fundamentally from strategies like dollar-cost averaging, which operate on a disciplined schedule independent of price signals. Technical indicators and systematic contribution strategies answer different questions and serve different purposes.
Used honestly — as one lens among several — moving averages remain among the most accessible and durable tools in market analysis. The discipline lies in knowing what they cannot tell you just as clearly as knowing what they can.
This article is for informational and educational purposes only and does not constitute personalized investment advice. Past market patterns do not guarantee future results. Consult a qualified financial professional before making investment decisions.
Frequently Asked Questions

Author
Stocks & Markets Editorial Team
Stocks & Markets Editorial Team is the collective byline for our editorial team and contributor network. Articles published under this byline or an editorial pen name are researched, written, and reviewed according to our editorial standards for clarity, consistency, and independence before publication.
View all articles →