
Misreading a Trend: Where Investors Often Go Wrong with Technical Signals
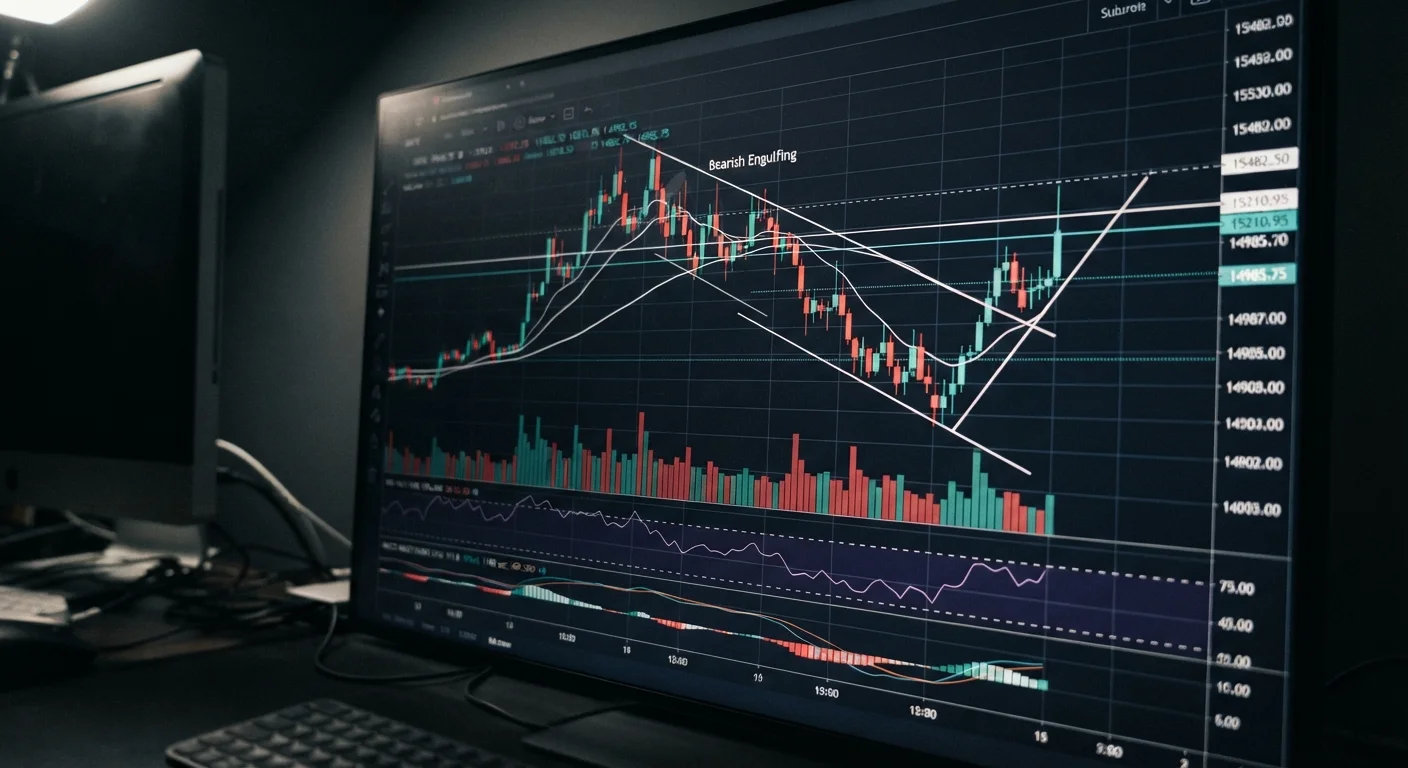
Photo credit: NewBizBuzz.net | Financial Insights For All
Acting on false breakouts, ignoring volume confirmation, and over-relying on a single indicator — explore the analytical pitfalls that distort decisions.
Key Takeaways
- Acting on a breakout without volume confirmation is one of the most costly errors in technical analysis.
- Relying on a single indicator ignores the multi-dimensional nature of market behavior.
- Timeframe mismatches cause traders to mistake short-term noise for meaningful trend shifts.
- Confirmation bias leads investors to selectively read charts in ways that validate existing positions.
- Context — sector conditions, macro backdrop, and fundamentals — matters as much as the signal itself.
Why Technical Signals Fail in Practice
Technical analysis offers a structured vocabulary for reading market behavior — support and resistance levels, moving averages, momentum oscillators, and pattern formations. But the discipline is only as reliable as the judgment applied to it. Investors who treat technical signals as mechanical rules, rather than probabilistic indicators requiring context, consistently expose themselves to costly misreads.
The mistakes below are not rare edge cases. They recur across market cycles and across experience levels — often because the underlying cognitive errors are difficult to self-diagnose. Understanding where analytical discipline breaks down is the first step toward more rigorous decision-making. For a broader view of how technical and fundamental approaches complement each other, see Technical Analysis vs Fundamental Analysis: Two Lenses on the Same Market.
Acting on a breakout before volume confirms it.
Why it happens: Price breaking through a resistance level looks decisive on a chart, creating urgency to act. Investors fear missing the move and enter before the signal has been validated by market participation.
Using a single indicator to make a directional decision.
Why it happens: Individual indicators such as RSI, MACD, or a simple moving average are easy to read in isolation. Investors simplify their process by anchoring to one metric, often the one that currently supports their view.
Conflating signals across incompatible timeframes.
Why it happens: A daily chart showing a bullish setup and a 15-minute chart showing a sell signal can appear contradictory, and investors often default to whichever timeframe suits the trade they want to make rather than resolving the conflict systematically.
Ignoring divergence between price and momentum indicators.
Why it happens: When a stock is making new highs, it feels counterintuitive to focus on a weakening RSI or MACD histogram. Investors attribute momentum divergence to indicator lag rather than recognising it as a potential leading signal.
Anchoring to a prior technical level that is no longer relevant.
Why it happens: Support and resistance levels from weeks or months ago feel significant because they were significant at the time. Investors carry these levels forward without reassessing whether market structure has shifted.
Letting confirmation bias dictate chart interpretation.
Why it happens: Once an investor holds a position or a thesis, chart patterns that support that view become more visible while contradictory signals are minimised or rationalised away. This is a well-documented cognitive distortion with real financial consequences.
The Role of Context and Confirmation
No technical signal exists in isolation. A bullish crossover on a moving average means something different in a broad uptrend than during a sector-wide deterioration or a high-uncertainty macro environment. Investors who strip signals from their context are, in effect, reading a sentence without reading the paragraph.
70%+
False breakouts that reverse within days
Market research consistently finds that a large proportion of apparent breakouts fail without volume confirmation, reversing back below the prior resistance level within one to five trading sessions.
3–5x
Signal reliability gain from indicator confluence
Studies in technical trading methodology suggest that requiring agreement across multiple independent indicator types substantially reduces false signal rates compared to single-indicator strategies.
Volume is the most frequently neglected contextual variable. Price movements on thin volume are inherently less reliable — they may reflect institutional positioning unwinding, low-liquidity hours, or simply noise. A breakout that lacks a corresponding spike in trading volume should be treated with skepticism until confirmed. Similarly, divergences between price action and momentum indicators — where price makes a new high but an oscillator like RSI does not — often signal weakening trend conviction before a reversal becomes visible on the price chart alone.
Investors prone to these errors are often also susceptible to the broader pattern of misreading risk signals described in Reading an Asset Class the Wrong Way. Sound analytical habits apply across asset types.
Chasing Signals in Low-Liquidity Conditions
Technical signals generated during pre-market hours, illiquid sessions, or periods of extremely low float can be deeply misleading. Thin markets allow small order flows to create dramatic-looking price movements that disappear once normal trading volume resumes. Always verify that the conditions producing a signal are representative of the broader market's participation before acting on them. This risk is particularly acute in smaller-cap stocks and certain crypto markets.
Ultimately, technical analysis is a lens, not a crystal ball. Used alongside fundamental grounding — including an awareness of valuation errors that distort investment decisions — it becomes a far more reliable input into a disciplined investment process. Readers making consequential portfolio decisions should consult a qualified financial adviser, as this content is general educational information and not personalised investment advice.
This article is for informational purposes only and does not constitute personalised financial or investment advice. Past market patterns do not guarantee future results. Please consult a licensed financial professional before making investment decisions.

Author
Stocks & Markets Editorial Team
Stocks & Markets Editorial Team is the collective byline for our editorial team and contributor network. Articles published under this byline or an editorial pen name are researched, written, and reviewed according to our editorial standards for clarity, consistency, and independence before publication.
View all articles →