
Fundamental Analysis vs. Relative Valuation: Two Schools of Thought on Equity Worth
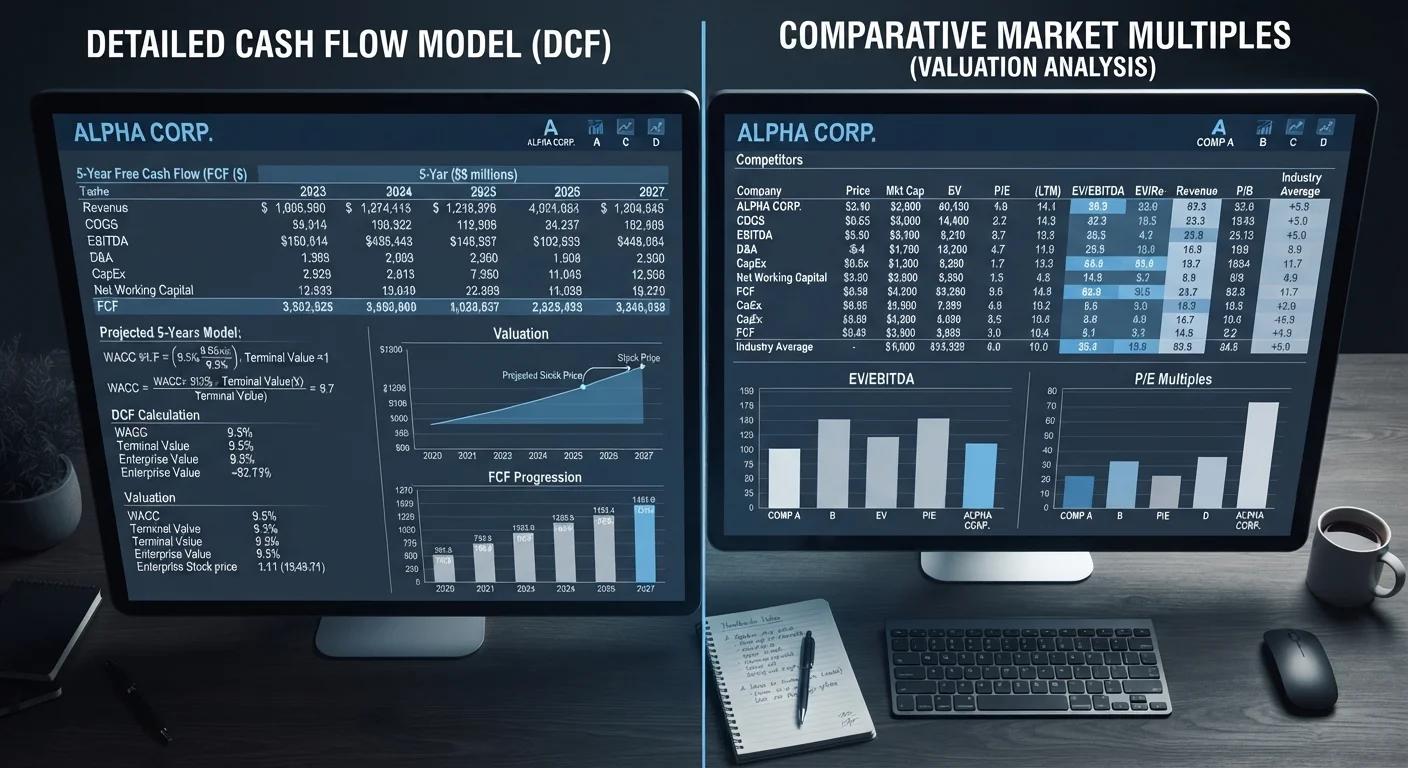
Photo credit: NewBizBuzz.net | Financial Insights For All
In this article
Explore the key differences between intrinsic value analysis and relative valuation methods, and when each approach tends to be most useful.
Key Takeaways
- Fundamental analysis estimates a stock's intrinsic value using cash flows, earnings, and financial statements, independent of current market prices.
- Relative valuation benchmarks a company against peers or historical norms using multiples such as P/E, EV/EBITDA, and P/B ratios.
- Each method carries distinct assumptions and failure modes — no single approach produces a definitive, guaranteed answer.
- Combining both frameworks often produces more robust investment hypotheses than relying on either in isolation.
- Sector context matters significantly; some industries are better suited to one valuation method over the other.
What Each Approach Actually Measures
At the heart of equity analysis lies a deceptively simple question: what is this stock worth? Two dominant frameworks attempt to answer it — and they start from very different premises.
Fundamental analysis, in its intrinsic value form, asks what a business would be worth if you stripped away market noise entirely. The most common tool is the DCF model, which projects a company's future free cash flows and discounts them back to the present using a rate that reflects the investment's risk — typically the weighted average cost of capital (WACC). The result is an estimated intrinsic value per share. If the current price falls meaningfully below that estimate, the stock may represent an opportunity; if it trades well above it, the stock may be overvalued. For a broader grounding in these methods, see our comprehensive guide to stock valuation.
Relative valuation, by contrast, makes no attempt to calculate an absolute price. Instead, it asks: how does this company compare to similar ones? Analysts apply standardized multiples — price-to-earnings (P/E), enterprise value-to-EBITDA (EV/EBITDA), price-to-book (P/B), or price-to-sales (P/S) — to a peer group or to the company's own historical range, then assess whether the current multiple looks high, low, or fair in context.
Neither method claims to deliver certainty. Both rest on assumptions that can prove wrong. Understanding which assumptions each method requires is essential before applying either. For a related contrast in analytical thinking, our piece on technical vs. fundamental analysis explores how market-price-based analysis differs from business-value analysis.
| Criterion | Fundamental Analysis | Relative Valuation |
|---|---|---|
| Core question | What is this business intrinsically worth? | How does this stock compare to peers? |
| Primary tools | DCF, dividend discount model, asset-based valuation | P/E, EV/EBITDA, P/B, P/S multiples |
| Market dependence | Independent of market pricing | Anchored to current market conditions |
| Key risk | Sensitive to assumption changes | Peers may all be mispriced |
| Best suited for | Stable, cash-flow-generating businesses | Sector screening and quick comparisons |
| Time to construct | Higher — requires detailed modeling | Lower — relies on standardized data |
| Output format | Estimated intrinsic value per share | Multiple relative to peers or history |
Strengths, Limitations, and Where Each Method Shines
The DCF model's primary virtue is its independence from prevailing market sentiment. During a broad market sell-off, relative valuations compress across the board — a stock can look cheap simply because everything looks cheap. An intrinsic value model, built on the company's own economic fundamentals, is less susceptible to this distortion. This makes fundamental analysis particularly useful for long-horizon, conviction-driven investors.
Its limitation is equally significant: small changes in growth rate assumptions or the discount rate can produce dramatically different intrinsic value estimates. A one-percentage-point shift in the terminal growth rate can swing a DCF output by 20–30% or more, depending on model structure. This sensitivity means that DCF outputs should be treated as ranges of probability, not precise targets.
Relative valuation sidesteps this sensitivity by anchoring to observable market data. It is faster to construct, easier to communicate, and inherently calibrated to current market conditions. Analysts routinely use peer multiples to cross-check DCF outputs or to screen large universes of stocks efficiently.
The principal risk is circular reasoning: if an entire sector is overvalued, a stock trading at the sector median P/E is not necessarily fairly priced — it may simply be overvalued in good company. Relative valuation can also obscure structural differences between businesses that look similar on paper but operate very differently in practice.
1%
Discount rate shift impact on DCF output
A one-percentage-point change in the discount rate assumption can alter a DCF valuation by 20–30% or more, illustrating the model's sensitivity to input assumptions.
~60%
Analysts using multiples as primary valuation check
Survey research by CFA Institute has consistently found that relative valuation multiples — particularly EV/EBITDA and P/E — are among the most frequently cited methods in equity research practice.
5–10x
P/S multiple range for high-growth tech vs. value sectors
High-growth technology companies have historically traded at price-to-sales multiples many times higher than capital-intensive industries, underscoring why cross-sector relative comparisons can mislead.
Sector context shapes which method is most applicable. As our sector-specific analysis explains, banks and insurers are typically assessed using price-to-book ratios, while technology firms often trade on revenue multiples. Capital-intensive industries may be better evaluated through EV/EBITDA. See sector-specific valuation frameworks for a detailed industry breakdown.
For portfolio construction purposes, both methods serve complementary roles. Fundamental analysis can anchor position sizing based on conviction about intrinsic worth, while relative valuation can flag when a position's multiple has expanded significantly beyond peers — a potential signal to revisit the thesis. Investors building diversified portfolios can explore foundational principles in our portfolio basics hub.
This article is for general informational and educational purposes only and does not constitute personalized investment, financial, legal, or tax advice. All investing involves risk, including the possible loss of principal. Past performance does not guarantee future results. Consult a qualified financial adviser before making decisions based on your individual circumstances.

Author
Stocks & Markets Editorial Team
Stocks & Markets Editorial Team is the collective byline for our editorial team and contributor network. Articles published under this byline or an editorial pen name are researched, written, and reviewed according to our editorial standards for clarity, consistency, and independence before publication.
View all articles →