
Active vs. Passive Investing: What the Evidence Actually Shows
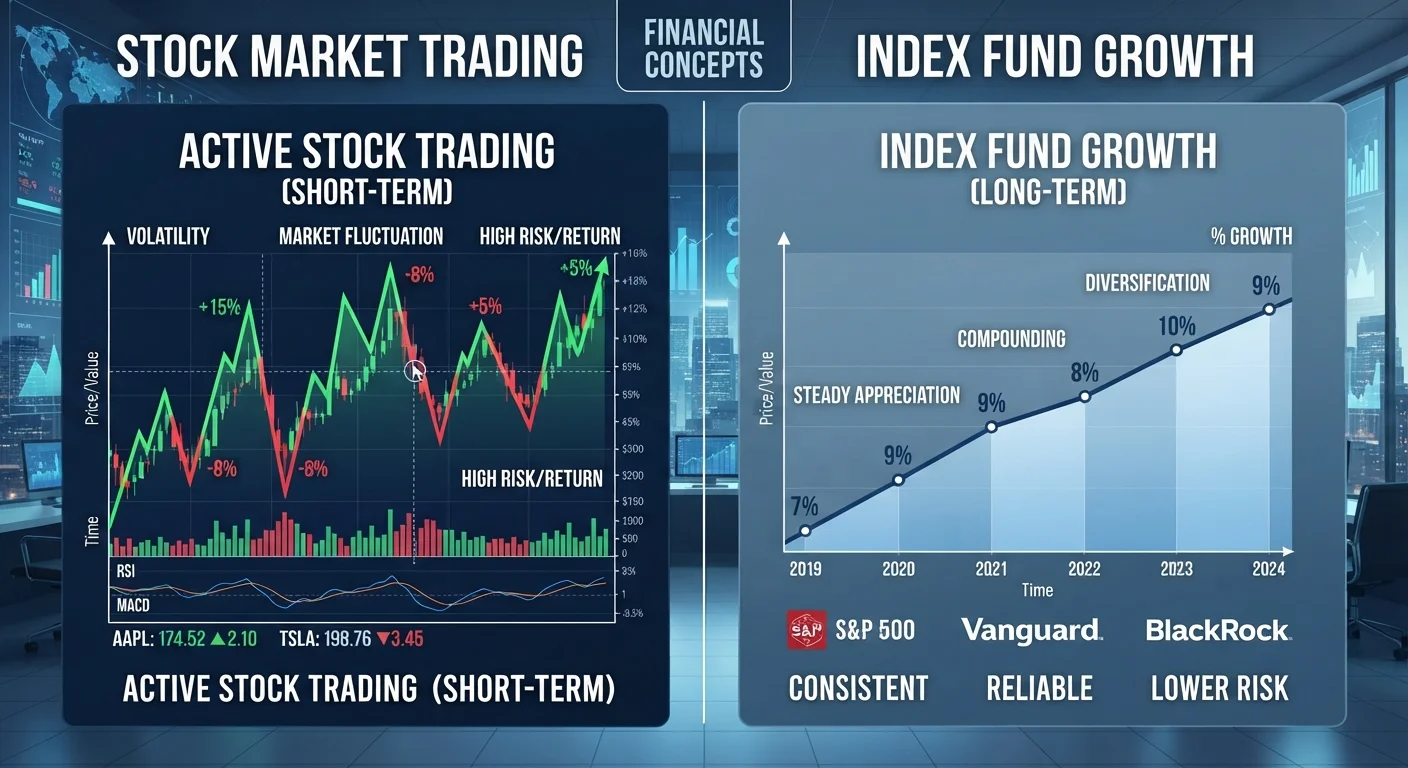
Photo credit: NewBizBuzz.net | Financial Insights For All
In this article
An evidence-based look at how active and passive investment strategies compare on cost, performance consistency, and long-term outcomes.
Key Takeaways
- The majority of actively managed funds underperform their benchmarks over long time horizons after accounting for fees.
- Passive funds' cost advantage compounds significantly over decades, often explaining much of the performance gap.
- A small subset of active managers does outperform persistently, but identifying them in advance is extremely difficult.
- Neither approach is universally superior — investor goals, time horizon, and tax situation all matter.
- Blending both strategies is a legitimate approach many institutional and individual investors employ.
The Core Distinction: Philosophy and Mechanism
Active investing attempts to outperform a market benchmark — such as the S&P 500 — through deliberate security selection, sector rotation, or market timing. Active managers research individual companies, interpret macroeconomic signals, and make discretionary portfolio decisions. The premise is that markets are not perfectly efficient and that skilled analysis can identify mispriced assets.
Passive investing, by contrast, seeks to replicate the returns of a specific index by holding its constituent securities in proportion to their weights. No judgment is exercised about which stocks are cheap or expensive. The strategy accepts that markets are generally efficient enough that consistent outperformance is unlikely to justify the costs of attempting it.
Both approaches can be implemented across major asset classes including equities, fixed income, and real assets. The debate between them is primarily empirical rather than philosophical — the evidence, not ideology, should guide investor decisions.
What the Performance Data Reveals
The most cited body of evidence on this question comes from the SPIVA (S&P Indices Versus Active) scorecards published by S&P Dow Jones Indices. Their research consistently shows that across most categories and time horizons, the majority of active US equity funds underperform their respective benchmarks on a net-of-fees basis. Over 15-year periods, this underperformance rate often exceeds 85–90% in large-cap categories.
~88%
Active US large-cap funds underperforming benchmark (15 years)
According to S&P Dow Jones Indices SPIVA data, roughly 88% of active US large-cap funds trailed the S&P 500 on a net-of-fees basis over a 15-year period.
0.03%
Expense ratio of lowest-cost index funds
Several broad US equity index funds now carry expense ratios as low as 0.03% annually, compared to industry averages of 0.5%–1.0% for actively managed counterparts.
<25%
Active outperformers maintaining edge in subsequent period
Research from S&P's persistence scorecards suggests fewer than 25% of top-quartile active managers repeat that ranking in the following five-year period.
This does not mean no active managers add value. Some do — and persistently. However, research by financial economists including those associated with Dimensional Fund Advisors and academic institutions such as the University of Chicago has shown that past outperformance has weak predictive power for future outperformance. Winners in one decade frequently become median or below-median performers in the next.
For context on how different investment philosophies handle this performance evidence, see our comparison of value investing vs. growth investing, where benchmark-relative thinking plays an equally important role.
The Cost Differential and Its Compounding Effect
Fees are not a minor footnote — they are a central determinant of long-run outcomes. A typical actively managed US equity mutual fund carries an expense ratio in the range of 0.5% to 1.0% or more annually. Comparable passive index funds often charge 0.03% to 0.20%. This gap, though small in any single year, compounds dramatically over decades.
| Criterion | Active Investing | Passive Investing |
|---|---|---|
| Typical expense ratio (US equity) | 0.50%–1.0%+ annually | 0.03%–0.20% annually |
| Benchmark outperformance rate (15-yr, large-cap) | ~10–15% of funds (net of fees) | Matches benchmark by design |
| Portfolio turnover | Higher; varies by strategy | Low; index-driven rebalancing |
| Tax efficiency | Generally lower | Generally higher |
| Manager skill dependency | High | None |
| Best suited market environment | Less-efficient, niche segments | Broad, liquid markets |
Consider a simplified illustration: on a $100,000 portfolio earning 7% annually before fees over 30 years, a 0.8% fee difference reduces terminal value by roughly $175,000 compared to a low-cost passive alternative — a purely mathematical outcome, not a forecast. Active funds also tend to generate higher portfolio turnover, which can create additional taxable events in non-sheltered accounts, further eroding after-tax returns.
The principles of cost control and long-term compounding are explored in greater depth in our guide to long-term stock market participation.
When Active Management May Be Justified
The case for passive investing is strongest in highly liquid, widely covered markets such as US large-cap equities, where information is rapidly incorporated into prices. In less-efficient segments — certain emerging markets, small-cap equities, high-yield credit, or niche alternatives — active managers have historically had a better opportunity set.
Institutional investors with access to rigorous manager due diligence processes sometimes allocate portions of their portfolios to active strategies in these areas. Individual investors considering active funds should scrutinize net-of-fee track records over full market cycles, manager consistency, and whether a clearly articulated investment process explains the performance.
Active vs. Passive: Not Always Binary
Many investors and institutions use a "core-satellite" framework — anchoring the majority of a portfolio in low-cost passive funds while allocating a smaller portion to carefully selected active strategies or factor-tilted funds. This approach attempts to capture the cost efficiency of indexing while preserving some flexibility to pursue targeted return premiums. It does not eliminate the challenge of manager selection, but it limits the damage if the active component underdelivers.
It is also worth noting that not all "passive" strategies are identical. Factor-based index funds (sometimes called smart beta) introduce active-like tilts — toward value, momentum, or quality, for example — within a rules-based, lower-cost structure. These occupy a middle ground that blurs the active-passive binary.
Investors weighing broader portfolio construction questions — including whether real assets complement an equity strategy — may also find value in our analysis of real estate as a wealth-building vehicle.
This article is for general informational and educational purposes only and does not constitute personalized investment, tax, or financial advice. All investing involves risk, including the possible loss of principal. Past performance does not guarantee future results. Consult a qualified financial adviser before making investment decisions specific to your circumstances.

Author
Stocks & Markets Editorial Team
Stocks & Markets Editorial Team is the collective byline for our editorial team and contributor network. Articles published under this byline or an editorial pen name are researched, written, and reviewed according to our editorial standards for clarity, consistency, and independence before publication.
View all articles →