
Correlations Between Asset Classes — and Why They Shift During Crises
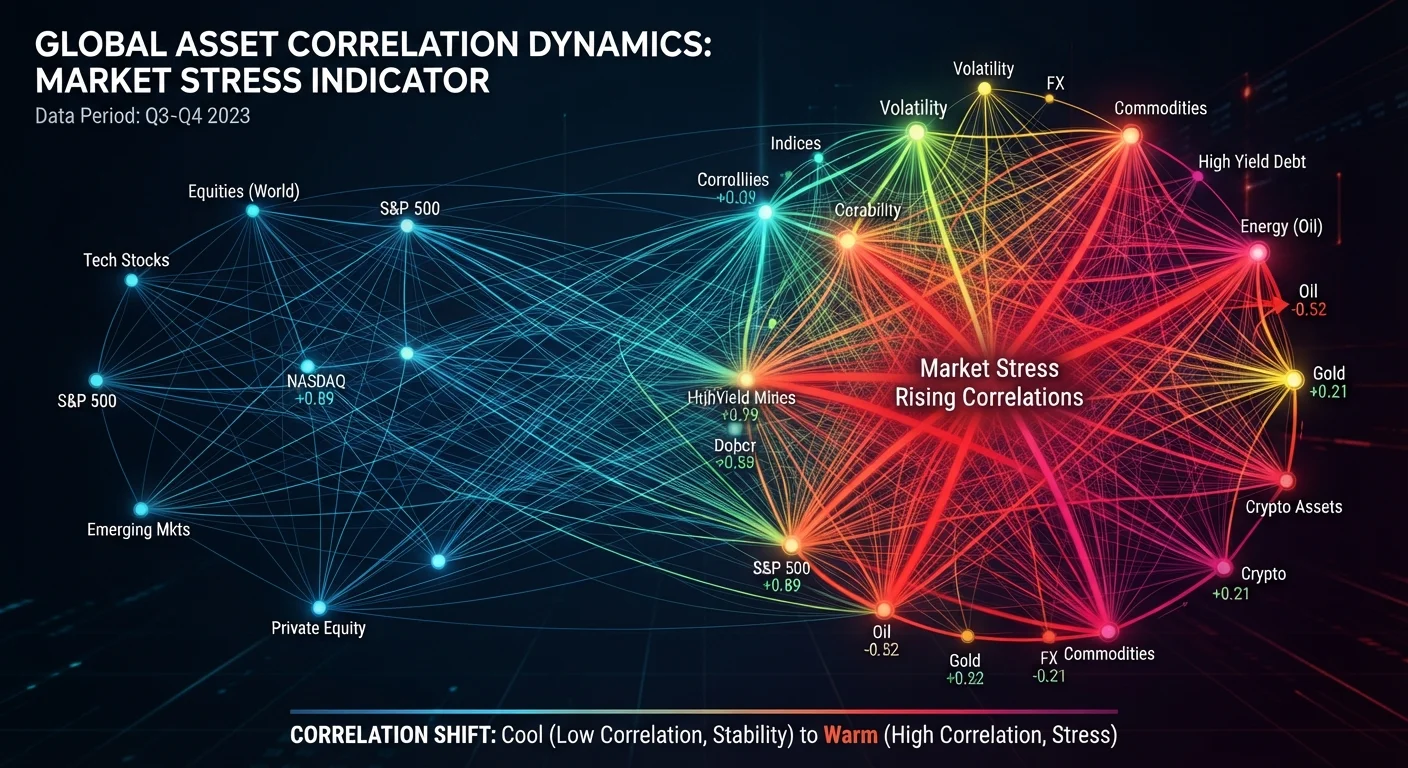
Photo credit: NewBizBuzz.net | Financial Insights For All
In this article
Diversification depends on assets moving independently. But correlations can converge when markets are stressed — here's what that means in practice.
Key Takeaways
- Correlations between asset classes are not fixed — they shift with market conditions.
- During crises, many assets that appear uncorrelated in calm markets tend to move together.
- The flight-to-quality phenomenon typically drives up bond and gold prices when equities fall sharply.
- Liquidity-driven selling is a primary mechanism behind correlation convergence in stressed markets.
- True diversification requires stress-testing assumptions about correlation, not just relying on historical averages.
- No diversification strategy eliminates all portfolio risk; a financial adviser can help calibrate realistic expectations.
What Correlation Actually Measures
When building a portfolio, the goal is not simply to own many different assets — it is to own assets whose returns behave differently from one another under varying conditions. Correlation quantifies that relationship using a scale from -1 to +1.
In practice, most asset pairs sit somewhere between these extremes. US large-cap equities and investment-grade corporate bonds, for example, have historically shown a mild negative to near-zero correlation over long horizons — meaning they do not consistently move together. International equities and domestic equities, by contrast, often show moderate positive correlation, because global economic cycles tend to pull in the same direction over time.
For a deeper grounding in how these relationships inform portfolio structure, see our Portfolio Basics hub, which covers the mechanics of balancing and allocating across asset classes.
~0.8
Peak US equity-high yield bond correlation in 2008
Research on 2008 crisis period data shows high-yield bond correlations with equities rose sharply from pre-crisis norms near 0.5, illustrating crisis convergence.
+0.6
Stock-bond correlation observed in 2022
According to analysis by financial research institutions, the US stock-bond correlation turned meaningfully positive during the 2022 inflationary environment, reversing two decades of negative correlation.
60+
Asset classes tracked in major multi-asset risk models
Institutional risk systems routinely monitor correlations across dozens of sub-asset classes to identify hidden concentration risks that simpler models miss.
Why Correlations Are Not Static
A critical mistake investors make is treating historical correlation figures as permanent features of asset classes rather than as estimates based on a specific market environment. Correlations are regime-dependent — they shift as economic conditions, monetary policy, and investor behavior change.
Consider the stock-bond relationship. For much of the period from the late 1990s through the early 2020s, US Treasury bonds provided reliable negative correlation to equities — acting as a buffer when stocks fell. That relationship reflected a low-inflation environment where central banks cut rates during downturns, lifting bond prices as equities declined. When inflation became the dominant risk in 2022, both asset classes fell together, eliminating that cushion simultaneously.
Understanding how each asset class behaves across the economic cycle is essential context for interpreting why correlations shift — because the macroeconomic regime determines which risks dominate market pricing.
“Diversification is the only free lunch in investing — but only when the correlations you're counting on actually hold. In a crisis, the lunch bill can arrive all at once.”
— Harry Markowitz, Nobel Prize-winning economist and pioneer of Modern Portfolio Theory
The Crisis Correlation Spike: Mechanisms and Evidence
The most disorienting phenomenon for diversified investors is sometimes called correlation convergence — the tendency for asset class correlations to spike toward +1 during acute market stress. This means that assets designed to counterbalance each other start falling together.
Several mechanisms drive this:
- Forced liquidation: Leveraged investors — including hedge funds and margin accounts — face redemption calls or margin requirements during crises. They sell liquid assets indiscriminately, regardless of the underlying risk profile, pushing prices down across the board.
- Risk-off sentiment: When fear dominates, distinctions between asset classes collapse. Investors exit anything perceived as risky, even assets that would normally behave differently from equities.
- Volatility spillover: Rising volatility in one market (e.g., equities) can trigger automated risk-reduction across multi-asset portfolios, generating selling pressure in other asset classes simultaneously.
The 2008 global financial crisis illustrated this clearly — investment-grade credit, high-yield bonds, commodities, international equities, and real estate investment trusts all declined sharply at the same time, undermining assumptions built on calmer-period data.
Digital assets present a related but distinct case. Crypto markets were initially described as uncorrelated with traditional assets, yet crisis periods have repeatedly shown a tightening of that relationship. The article on why crypto correlation shifts in a crisis examines the mechanics of this behavior in depth.
Building Portfolios That Account for Correlation Risk
Recognizing that correlations shift does not mean abandoning diversification — it means practicing it more rigorously. Several principles apply:
Distinguish between structural and cyclical diversifiers. Bonds may offer cyclical diversification in deflationary downturns but not inflationary ones. Certain assets — including commodities and inflation-linked securities — are structurally different from equity risk in ways that hold across more environments.
Stress-test correlation assumptions. Rather than relying solely on long-run averages, model what your portfolio looks like if correlations between major positions rise toward 0.7 or 0.8. This surfaces concentration risk that calm-period data obscures.
Consider liquidity tiers. In a crisis, the assets you can sell are the ones that get sold. Portfolios with illiquid sleeves may appear diversified but can become effectively concentrated when liquidity disappears.
Stress-Test Your Correlation Assumptions
Before assuming your portfolio is well-diversified, model a scenario in which all equity-sensitive positions move together. If the simulated loss is uncomfortable, your portfolio may carry more concentrated risk than the asset labels suggest. A qualified financial adviser can help you run this analysis against your actual holdings and risk tolerance.
For a structured examination of how genuine diversification differs from simply owning more assets, see Diversification as a Defensive Tool, which covers geographic, currency, and structural dimensions of portfolio protection. Also foundational is the core principles of diversification and its limits during market downturns.
This article is for general informational and educational purposes only and does not constitute personalized investment, financial, or tax advice. All investments carry risk, including the potential loss of principal. Past performance does not guarantee future results. Please consult a qualified financial adviser before making decisions about your own portfolio.
Frequently Asked Questions

Author
Investing Fundamentals Editorial Team
Investing Fundamentals Editorial Team is the collective byline for our editorial team and contributor network. Articles published under this byline or an editorial pen name are researched, written, and reviewed according to our editorial standards for clarity, consistency, and independence before publication.
View all articles →