
Balance Sheet Literacy: Assets, Liabilities, and Equity Decoded
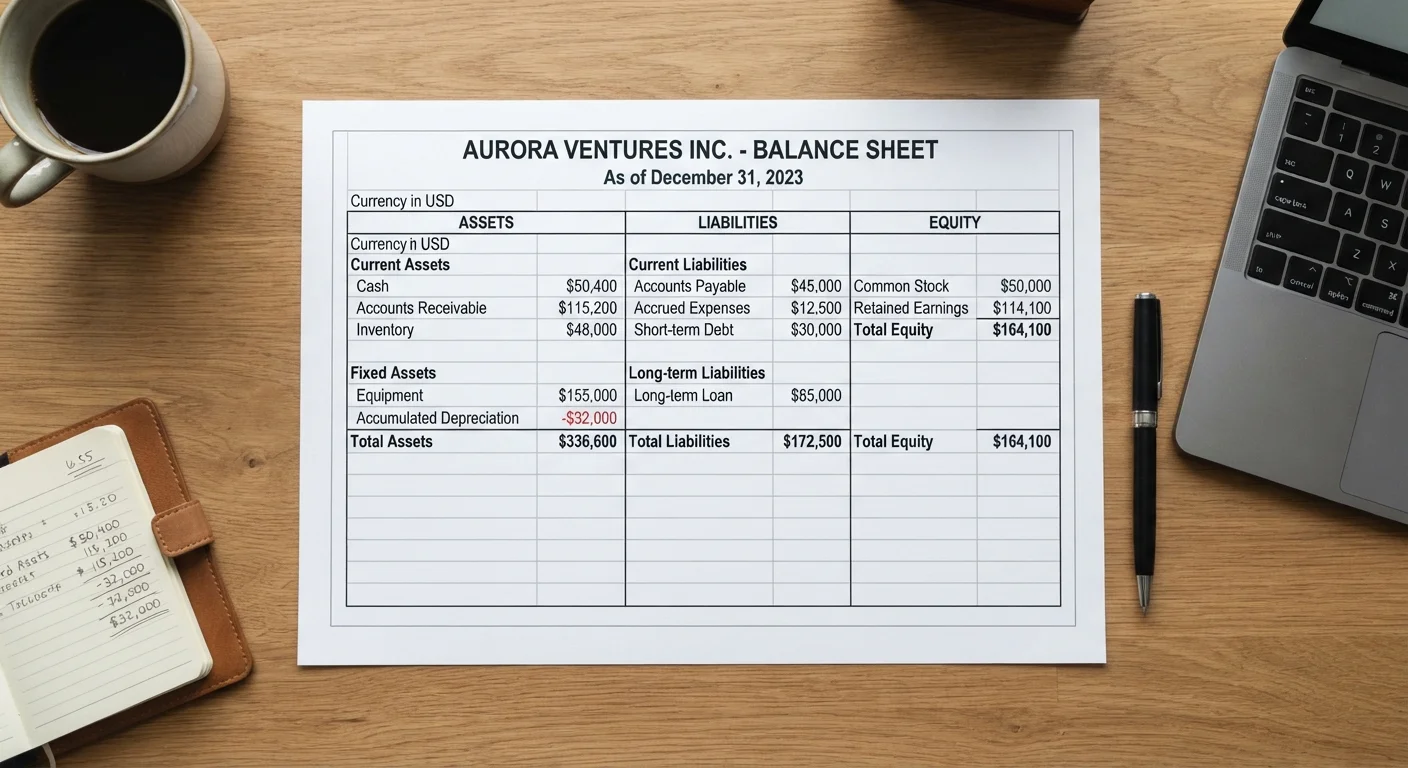
Photo credit: NewBizBuzz.net | Financial Insights For All
In this article
A comprehensive introduction to balance sheet mechanics — what each line item represents, how they interrelate, and the warning signs investors should watch for.
Key Takeaways
- The accounting equation — Assets = Liabilities + Equity — must always balance by definition.
- Current assets and current liabilities reveal a company's short-term liquidity position.
- Retained earnings within equity reflect cumulative profit kept inside the business.
- High leverage ratios signal meaningful financial risk that warrants deeper scrutiny.
- Off-balance-sheet items can hide significant obligations not visible in standard line items.
What a Balance Sheet Actually Measures
A balance sheet — formally called the statement of financial position — captures a company's financial standing at a single point in time. Unlike an income statement, which measures performance over a period, the balance sheet is a snapshot: what does the business own, what does it owe, and what is left over for its owners?
That snapshot is governed by one identity: Assets = Liabilities + Equity. Every transaction a business records preserves this equation, which is why the two sides of the statement always balance — by construction, not coincidence.
For investors and analysts, the balance sheet answers foundational questions: Can this company pay its near-term bills? Is it carrying too much debt relative to its asset base? Has the business been accumulating value for shareholders over time? Learning to read it accurately begins with understanding each of its three major sections. For an accessible primer on core vocabulary, see the accounting terms reference guide in our Accounting Basics hub.
Accounting equation
The rule that Assets = Liabilities + Equity must hold at all times. Every recorded transaction preserves this balance.
Current assets
Assets expected to be converted to cash or used up within twelve months, such as cash, receivables, and inventory.
Current liabilities
Obligations due within twelve months, including accounts payable, short-term loans, and accrued expenses.
Retained earnings
The accumulated net income a company has kept — rather than paid out as dividends — since it was founded.
Goodwill
An intangible asset recorded when a company pays more than the fair value of another firm's identifiable assets during an acquisition.
Debt-to-equity ratio
A leverage metric calculated by dividing total debt by total equity; higher values indicate greater reliance on borrowed funds.
Liquidity
A company's ability to meet its short-term obligations using assets that can be quickly converted to cash.
Shareholders' equity
The owners' residual claim on assets after all liabilities have been subtracted; also called net assets or book value.
Assets: What the Business Owns and Controls
Assets are economic resources the company controls that are expected to generate future benefit. They are reported at historical cost or fair value depending on the asset type and applicable accounting standard.
- Current assets — cash and equivalents, accounts receivable, inventory, and prepaid expenses — are expected to be converted to cash or consumed within twelve months. These determine day-to-day operational liquidity.
- Non-current (long-term) assets include property, plant and equipment (PP&E), intangible assets such as patents and trademarks, goodwill arising from acquisitions, and long-term investments.
Goodwill deserves special attention: it appears only when a company acquires another at a price above the fair value of identifiable net assets. A large and growing goodwill balance can indicate acquisition-heavy growth strategies that carry their own integration risks.
Liabilities: Obligations That Must Be Settled
Liabilities represent claims that creditors hold against the company's assets — obligations that will require future outflows of cash or services.
- Current liabilities — accounts payable, short-term debt, accrued expenses, and the current portion of long-term debt — are due within twelve months. They are compared directly against current assets to assess liquidity.
- Non-current liabilities include long-term bonds, deferred tax liabilities, pension obligations, and lease liabilities. These represent the company's longer-dated financial commitments.
The relationship between debt and equity is captured by the debt-to-equity ratio. A high ratio can indicate elevated financial risk, particularly if earnings are volatile or interest coverage is thin. However, capital-intensive industries such as utilities or telecommunications routinely carry higher leverage than technology or service firms — context matters.
Leverage Ratios Require Industry Context
A debt-to-equity ratio that looks alarming for a software company may be entirely normal for a utility or real estate investment trust. Always benchmark leverage ratios against industry peers and consider the stability of the company's cash flows before drawing conclusions. High leverage combined with volatile revenues is a particularly meaningful risk signal.
Equity: The Residual Interest
Equity — also called shareholders' equity or stockholders' equity — is the residual: what remains after subtracting all liabilities from total assets. It is not cash on hand; it is an accounting value representing the owners' stake in the enterprise.
Equity typically comprises:
- Common stock and additional paid-in capital — the amount shareholders have invested directly.
- Retained earnings — cumulative net income kept in the business rather than distributed as dividends. This is a critical indicator of whether a company has consistently generated profit over time.
- Treasury stock — shares repurchased by the company, recorded as a deduction from equity.
- Accumulated other comprehensive income (AOCI) — unrealized gains and losses on certain investments and hedging instruments, among other items.
Retained earnings tell a long-run story. A company with steadily growing retained earnings has been generating more profit than it distributes — a positive signal. Persistently negative retained earnings (accumulated deficits) suggest a history of losses.
Use Retained Earnings as a Trend Indicator
Rather than looking at retained earnings as a single snapshot figure, track it across multiple reporting periods. Consistent growth signals a business that earns more than it distributes — a useful quality indicator. A declining balance, absent a deliberate dividend or buyback program, deserves closer investigation into profitability trends.
How the Three Sections Interact
The three sections do not exist in isolation. Every major business decision reshapes the balance sheet in predictable ways. Borrowing cash to buy equipment raises both assets and liabilities simultaneously. Issuing new shares increases assets (cash received) and equity (paid-in capital). Generating a net profit flows into retained earnings, lifting equity — and, somewhere on the asset side, increasing cash or receivables.
Two ratios derived from the balance sheet are especially instructive:
- Current ratio = Current Assets ÷ Current Liabilities. A ratio above 1.0 generally indicates sufficient short-term liquidity, though optimal levels vary by industry.
- Debt-to-equity ratio = Total Debt ÷ Total Equity. This measures financial leverage and risk exposure to creditors.
The balance sheet also connects to the other core financial statements: net income from the income statement feeds retained earnings, and cash flows from the cash flow statement explain changes in the cash line within current assets.
Warning Signs Every Investor Should Recognize
Reading a balance sheet critically means looking beyond headline totals. Several patterns deserve heightened scrutiny:
- Rapid growth in accounts receivable relative to revenue may indicate collection problems or aggressive revenue recognition.
- Inventory buildup without corresponding sales growth can signal demand weakness or obsolescence risk.
- Goodwill impairment charges suggest past acquisitions did not deliver expected value.
- Declining equity or negative equity warrants analysis of whether losses are structural or temporary.
- Rising short-term debt replacing long-term debt can tighten liquidity and create refinancing risk.
Equally important is what a standard balance sheet may not show. Operating leases, special purpose vehicles, and contingent liabilities can keep significant obligations off the main statement. Our article on off-balance-sheet items explains where to find these exposures and how to factor them into analysis.
For readers who want to practice interpreting real statements, our companion guide on reading a balance sheet without an accounting degree offers a structured walkthrough.
This article is for general informational and educational purposes only and does not constitute personalised financial, investment, accounting, or legal advice. Readers should consult a qualified financial adviser, CPA, or attorney before making decisions based on their individual circumstances.
SEC EDGAR Financial Statements
The SEC's public database provides access to balance sheets and full financial filings for all US-listed public companies — an essential resource for practicing real-world statement analysis.
Off-Balance-Sheet Items Explainer
Our companion article covers operating leases, special purpose vehicles, and contingent liabilities that may not appear on the main statement but can significantly affect a company's true financial position.
Accounting Basics Hub
A curated collection of foundational accounting articles covering core principles, key terms, and financial statement interpretation for finance-savvy adults.
Frequently Asked Questions

Author
Accounting & Tax Editorial Team
Accounting & Tax Editorial Team is the collective byline for our editorial team and contributor network. Articles published under this byline or an editorial pen name are researched, written, and reviewed according to our editorial standards for clarity, consistency, and independence before publication.
View all articles →