
Risk-Adjusted Returns: Evaluating Investments on More Than Just Performance
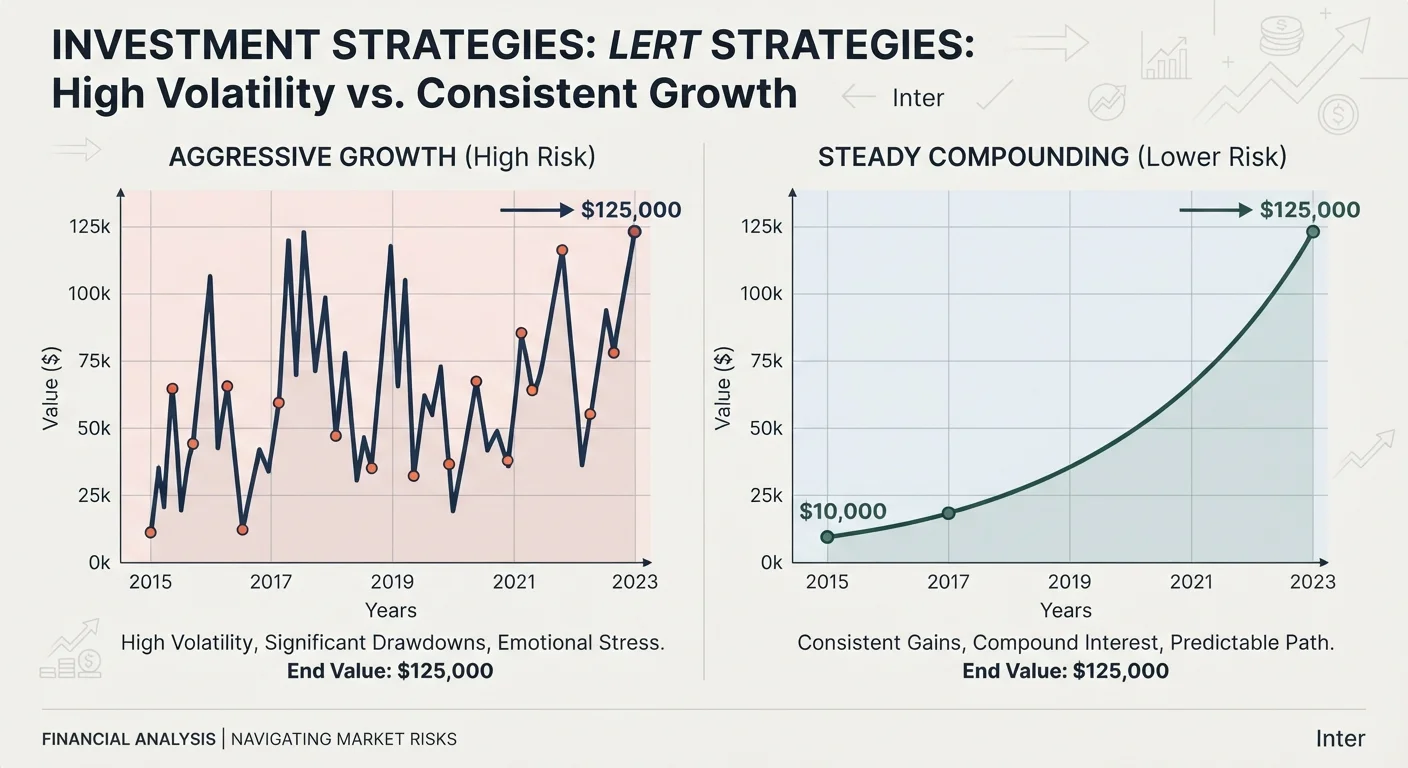
Photo credit: NewBizBuzz.net | Financial Insights For All
In this article
Raw returns tell only part of the story. Understanding risk-adjusted measures helps you compare investments on equal footing.
Key Takeaways
- Raw returns ignore the risk taken to achieve them, which can mislead investors comparing different assets.
- Risk-adjusted metrics like the Sharpe ratio let you compare investments on equal footing.
- A higher return isn't always better if it required significantly more volatility or downside exposure.
- Understanding risk-adjusted performance is essential for building portfolios aligned with your goals.
- Past risk-adjusted performance does not guarantee future results — use these metrics as one tool, not the only one.
Why Raw Returns Can Mislead
Imagine two portfolios: one returned 14% last year, the other returned 10%. On the surface, the first looks superior. But what if the 14% portfolio swung wildly — dropping 25% mid-year before recovering — while the 10% portfolio climbed steadily with minimal turbulence? For many investors, the smoother ride would be far more valuable, and far less likely to prompt panic selling at the worst moment.
This is the core problem with evaluating investments on raw returns alone. Performance figures tell you what happened, but not what it cost to get there in terms of risk exposure. Two investments can reach the same destination through very different journeys, and that difference matters deeply for real-world decision-making.
As explored in our overview of the risk-return tradeoff, higher returns almost always come with greater risk. Risk-adjusted metrics make that relationship explicit and measurable.
0.6–0.8
Typical long-run Sharpe ratio for broad US equity indices
Research on historical US stock market data generally places the long-run Sharpe ratio for broad equity indices in this range, varying by time period and risk-free rate used.
3 of 4
Active funds that underperform their benchmark after fees over 15 years
According to SPIVA scorecards published by S&P Dow Jones Indices, the majority of actively managed US equity funds have underperformed their benchmark index over long periods after costs — illustrating that raw outperformance alone is rare and alpha is often elusive.
The Most Widely Used Risk-Adjusted Metrics
Several established measures help investors compare performance on a level playing field. Each captures a slightly different dimension of risk.
Sharpe Ratio
The Sharpe ratio divides an investment's excess return — meaning return above the risk-free rate, typically proxied by short-term U.S. Treasury yields — by its standard deviation. A higher ratio indicates more return earned per unit of volatility. It's the most widely cited risk-adjusted metric and works well for comparing funds or portfolios with similar structures.
Sortino Ratio
The Sortino ratio refines the Sharpe ratio by penalizing only downside volatility — the fluctuations that actually hurt investors. Upside volatility (prices rising sharply) is excluded from the denominator. For investors primarily concerned with avoiding losses, the Sortino ratio can be a more relevant measure.
Alpha
Alpha represents the return an investment generates above what would be expected given its level of market risk (beta). Positive alpha suggests a manager or strategy added value beyond simply riding market movements. Zero alpha means performance was entirely explained by market exposure.
For a deeper breakdown of how standard deviation, beta, and these ratios are calculated, see our plain-language guide to investment risk metrics.
“The goal of investing is not to maximize return, but to maximize return per unit of risk taken.”
— William F. Sharpe, Nobel Laureate in Economics and developer of the Sharpe ratio
Putting Risk-Adjusted Thinking Into Practice
Understanding these metrics is one thing; applying them consistently is another. Here are the most productive ways to integrate risk-adjusted thinking into portfolio evaluation.
Compare like with like. Risk-adjusted metrics are most useful when comparing investments in the same category — two large-cap equity funds, for instance, or two bond strategies. Comparing the Sharpe ratio of a money market fund to a growth equity fund tells you little of practical value.
Consider the time period. A high Sharpe ratio calculated over a bull market may not reflect how an investment would perform during a downturn. Evaluating metrics across multiple market cycles provides a more robust picture.
Use multiple metrics together. No single ratio captures all relevant dimensions of risk. Pairing the Sharpe ratio with the Sortino ratio, for example, reveals whether strong risk-adjusted returns depend on limiting downside specifically — or simply on low overall volatility.
This principle parallels a concept in accounting: just as profitability ratios reveal more than raw profit figures, risk-adjusted returns reveal more than raw performance numbers alone.
Start With the Sharpe Ratio, Then Go Deeper
When evaluating any investment, start by looking at its Sharpe ratio relative to comparable investments in the same category. If the ratio looks favorable, investigate further using the Sortino ratio and alpha to understand the source and quality of that risk-adjusted performance. This layered approach helps you avoid being misled by any single metric.
Investors building diversified portfolios can find further context in our Portfolio Basics hub, which covers construction, diversification, and balance across asset classes.
This article is for general informational and educational purposes only and does not constitute personalized financial, investment, or tax advice. Past performance does not guarantee future results. Please consult a qualified financial adviser before making investment decisions.
Frequently Asked Questions

Author
Investing Fundamentals Editorial Team
Investing Fundamentals Editorial Team is the collective byline for our editorial team and contributor network. Articles published under this byline or an editorial pen name are researched, written, and reviewed according to our editorial standards for clarity, consistency, and independence before publication.
View all articles →